|
Atmospheric
Circulation
Analyzing air pressure patterns
Meteorologists have a variety of ways to
visualize weather data, a map being the most common.
To analyze pressure patterns, a constant height map is
often used. A constant height map
(also known as a "constant height chart") shows the
distribution of pressure at sea level. Isobars,
lines connecting points of equal air pressure are used
to show pressure patterns on constant height maps.
Most of the maps of air pressure in this book are
constant height maps.
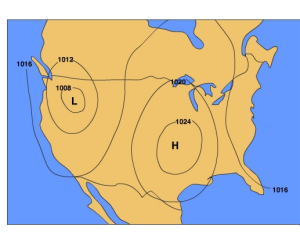
Figure 6.4 Constant height map with
isobars
Another map that is used to analyze pressure patterns
is called a constant pressure
map (also known as a "constant pressure
chart"). A constant pressure map shows the change in
elevation of an isobaric surface
which is a surface upon which the pressure is the same
at all locations. By examining the height of an
isobaric surface relative to it's normal elevation,
one can discern where areas of high and low pressure
are.
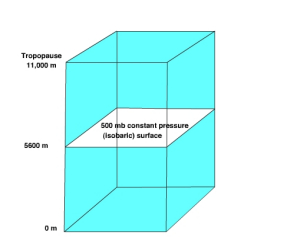
Figure 6.5 500 mb constant pressure
(isobaric) surface
The 500 mb surface is commonly used to by
meteorologists in weather forecasting. The normal
height of 500 mb surface is 5600 meters. Recall, that
at the surface we consider high pressure to be
greater than normal sea level pressure and low
pressure to be less than normal sea level
pressure. In a similar way we can use the normal
height of the 500 mb surface to identify where high
and low pressure areas are located.
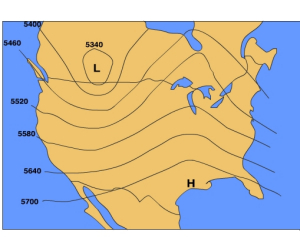
Figure 6.6 Constant pressure map with
contour lines
Let's consider a simple situation to understand how
the height of an isobaric surface relates to air
pressure. Recall that air pressure is related to force
exerted by the weight of a column of air above a given
point. If air temperature varies through any part of
an air column, the density and pressure will also
vary. Figure 6.7 shows a column with warm air to the
left and cool air to the right. The 500 mb surface is
shown as the white surface dipping from left to right.
Let's assume that the surface pressure remains
constant. When air is heated it becomes bouyant
causing it to rise and when cooled it sinks. As the
warm air rises more air molecules will be found above
5600 meters than normal and thus the 500 mb
surface is found at a higher elevation. To the right
where cold air has sunk to the surface fewer air
molecules than normal are found above 5600 meter and
thus the 500 mb surface is found at a lower elevation.
If the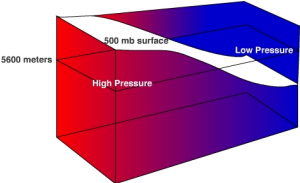 re are more molecules above
5600 meter in the warm region, then high pressure is located
at 5600 meters. If fewer air molecules are above
5600 meters in the cold region, then low pressure is located
at 5600 meters. re are more molecules above
5600 meter in the warm region, then high pressure is located
at 5600 meters. If fewer air molecules are above
5600 meters in the cold region, then low pressure is located
at 5600 meters.
Figure 6.7 Air pressure - isobaric
surface height relationship
Previous
| Continue
|