Temperature Trends
 Figure 5.15
Geoscientist examines ice core used to study
changes in atmospheric composition. (Courtesy: National Ice Core Laboratory, NOAA)
Figure 5.15
Geoscientist examines ice core used to study
changes in atmospheric composition. (Courtesy: National Ice Core Laboratory, NOAA)
The fact that atmospheric gases contribute
to the heating of the Earth is not new. A hundred years
ago, Swedish scientist Svante Arrhenius ![]() became
the first person to investigate the effect that doubling
atmospheric carbon dioxide would have on global climate.
Though all atmospheric scientists agree that there is a
greenhouse effect, not all agree on the impact that human
beings are having on it. In particular, many cannot agree
that the present global warming that we are experiencing
is a product of human activities. Analysis of ice cores
has shown a significant variation in the carbon dioxide
content of our atmosphere which has affected global air
temperatures since the great ice sheets marched across the
continents. Measurements of greenhouse gas concentrations
over the last 150 years have shown a steady increase in
carbon dioxide with an apparent increase in global
temperatures as a result. Research has shown that there
has been a 30% increase in the carbon dioxide content
since the dawn of the industrial age. This increase is due
to a number of activities such as fossil fuel burning,
deforestation, and loss of other carbon dioxide "sinks"
like wetlands and forests. The burning of fossil fuels
releases stored carbon into the atmosphere raising the
carbon dioxide content of the air. Forest removal
leaves carbon dioxide in the air to enhance the natural
greenhouse effect.
became
the first person to investigate the effect that doubling
atmospheric carbon dioxide would have on global climate.
Though all atmospheric scientists agree that there is a
greenhouse effect, not all agree on the impact that human
beings are having on it. In particular, many cannot agree
that the present global warming that we are experiencing
is a product of human activities. Analysis of ice cores
has shown a significant variation in the carbon dioxide
content of our atmosphere which has affected global air
temperatures since the great ice sheets marched across the
continents. Measurements of greenhouse gas concentrations
over the last 150 years have shown a steady increase in
carbon dioxide with an apparent increase in global
temperatures as a result. Research has shown that there
has been a 30% increase in the carbon dioxide content
since the dawn of the industrial age. This increase is due
to a number of activities such as fossil fuel burning,
deforestation, and loss of other carbon dioxide "sinks"
like wetlands and forests. The burning of fossil fuels
releases stored carbon into the atmosphere raising the
carbon dioxide content of the air. Forest removal
leaves carbon dioxide in the air to enhance the natural
greenhouse effect.
Figure 5.16 Global
mean temperature Anomalies relative to 1901 - 2000
temperature
Courtesy NCDC/NESDIS/NOAA
Increasing levels of greenhouse gases results in rising global air temperatures. Global mean surface temperatures have increased roughly 1.53°F (0.85ºC) from 1880 to 2012. The annual trend in average global air temperature through December 2012 is shown in Figure 5.16. The range of measurement uncertainty is indicated by the gray vertical bars. The temperature trends over the past 100-plus years in Figure 5.17 clearly indicate rising temperatures on all continents and over the oceans.
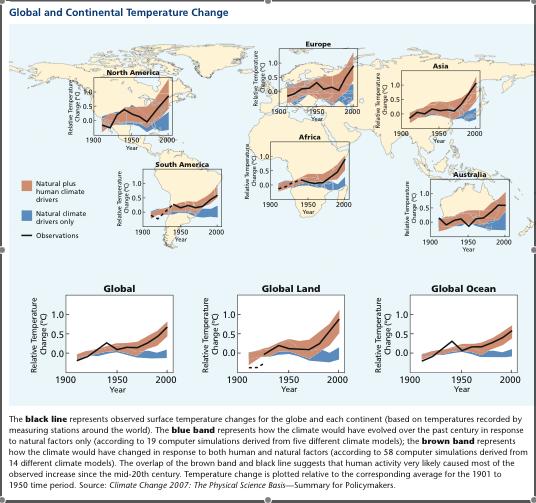
Figure 5.17 Global and Continental Temperature Change, 1900 - 2000. Data for the last hundred years already show clear trends in warming for the globe and continents. (Source)
The last decade, 2000-2009, ended on the second warmest year on record. The temperature anomaly map (Figure 5.18) shows the departure from "normal" for the reference period of 1951 through 1980. Very little of the earth showed cooling while most experienced warming. The greatest warming occurred in the Arctic, coinciding with changes in surface albedo as annual sea ice diminishes.
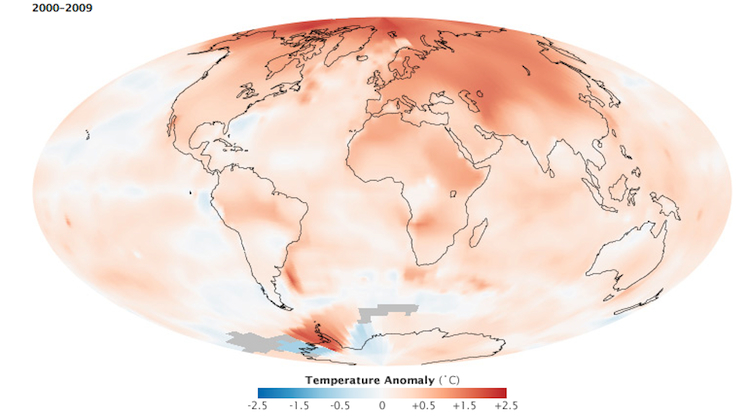
Figure 5.18 2000 - 2009
Temperature Anomaly.
Courtesy NOAA EOS (Source)
Video:
"Global Warming 101"
Courtesy of National Geographic