Historical
Land Use Maps
Eastern
United States, 1850-1950
James
Dyer
Professor of
Geography

These maps represent an "appendix" of sorts for our article:
McEwan, R.W., J.M. Dyer, and N.
Pederson. 2011. Multiple interacting ecosystem drivers: toward
an encompassing hypothesis of oak forest dynamics across eastern
North America. Ecography 34: 244-256.
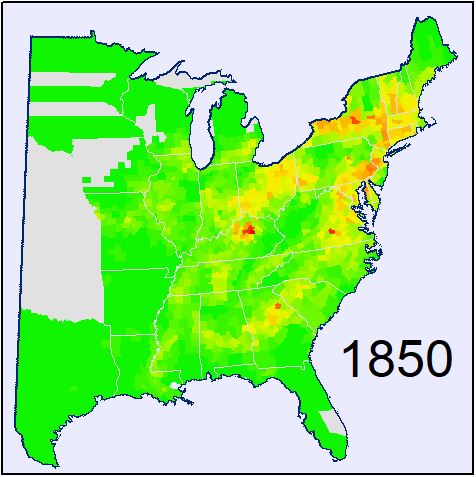
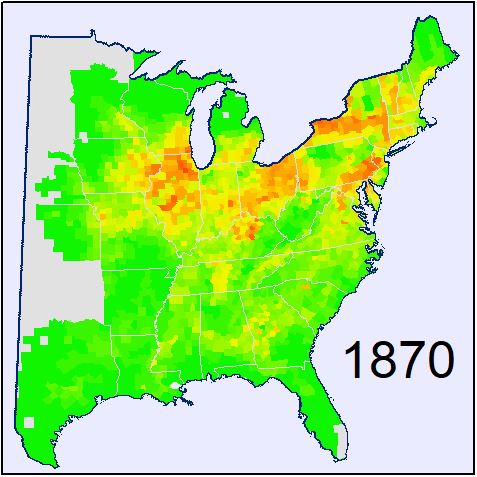
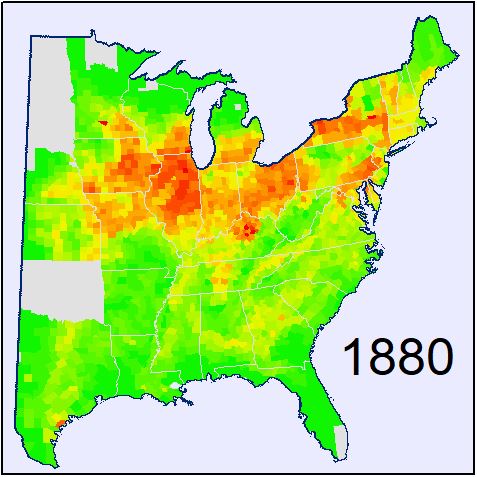
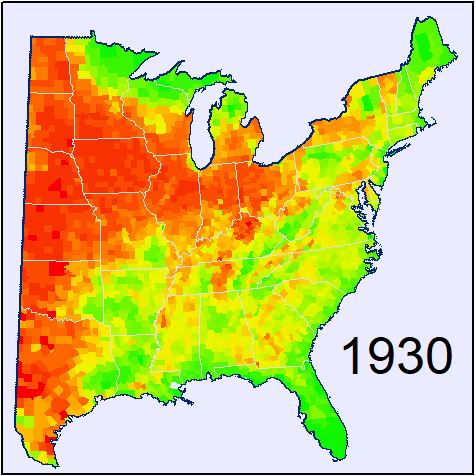
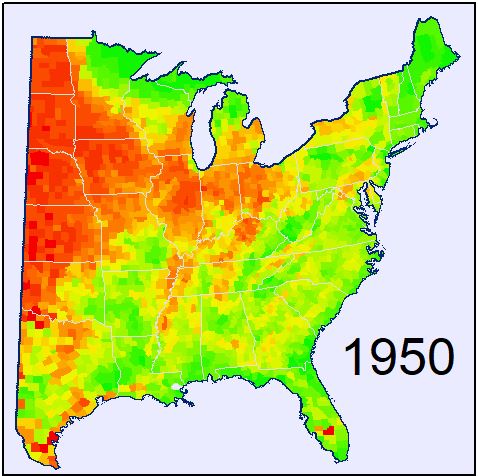
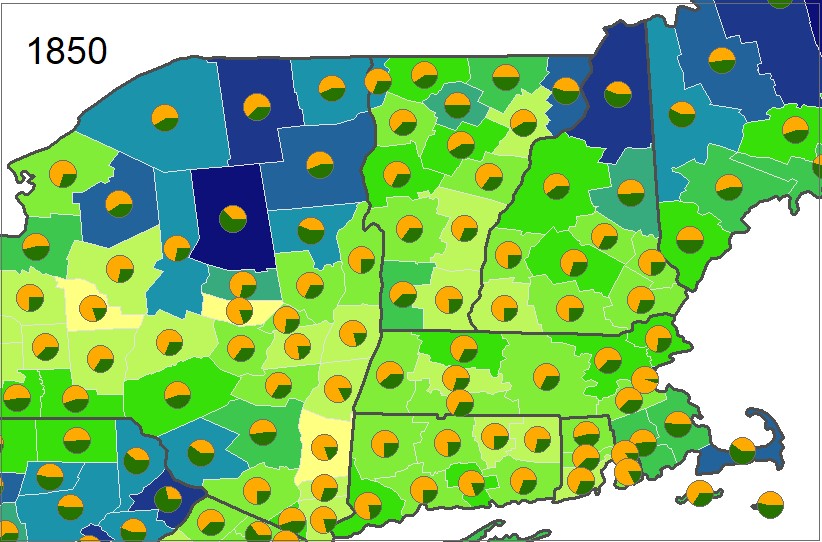
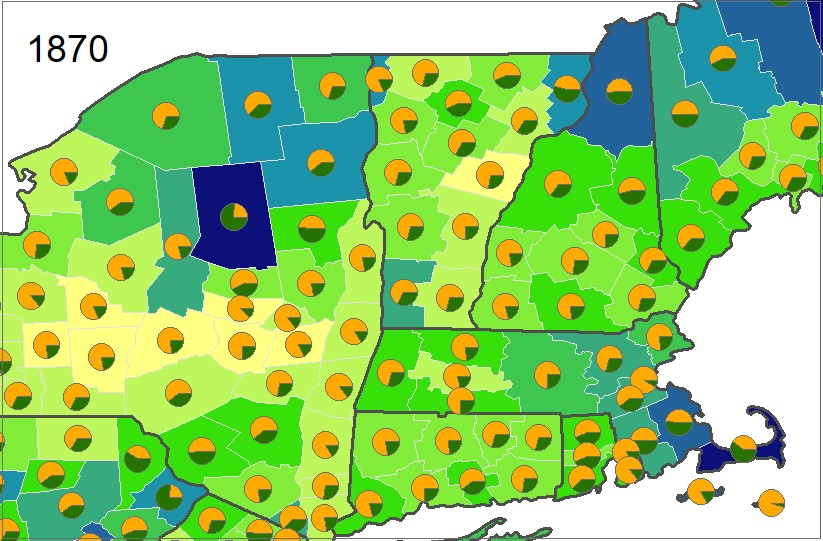
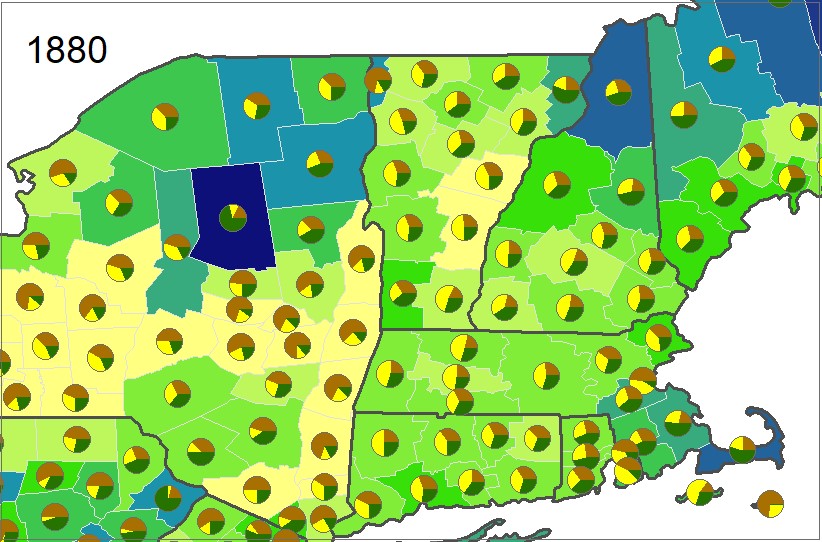
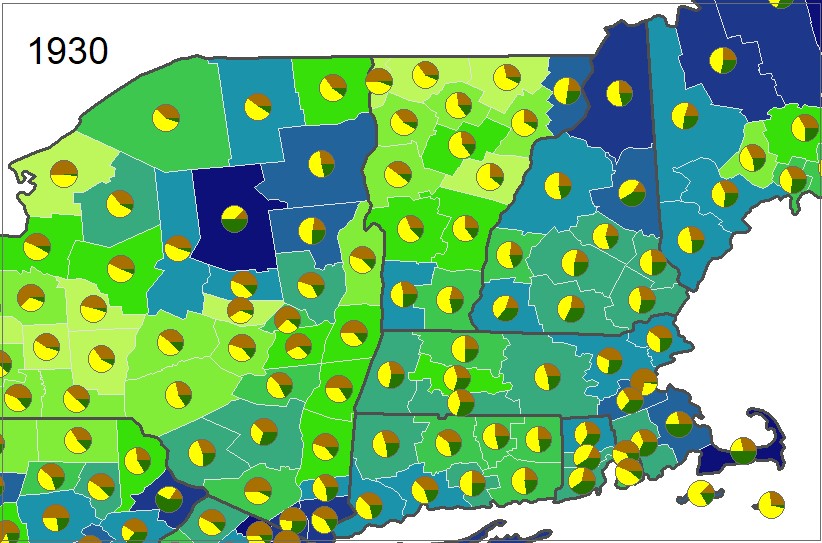
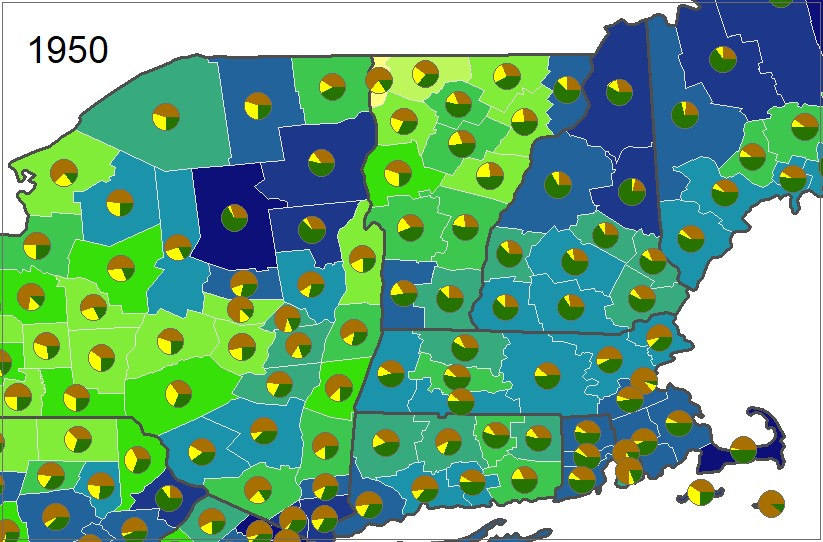
The maps below depict conversion of forest to
agriculture (and subsequent reforestation) in the eastern U.S.,
1850-1950. Data are derived from the U.S. Census, and
utilize Historical United States County Boundary Files (HUSCO 1790
- 1999). (Figure 4 in the article utilized the same data
sources.) Land use data in the census became more "granular" in
the 20th century, but these maps were designed to show changing
conditions over time. They represent just a sample, so if
you have questions about additional
possibilities, or about the
development of the maps, feel free to contact me: dyer@ohio.edu.
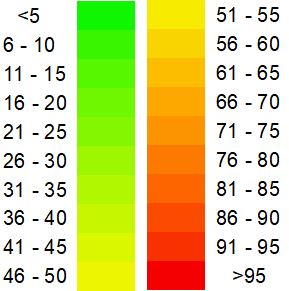
Series 1: "Improved" land
(cleared woodland on farms), as a percentage of county land area
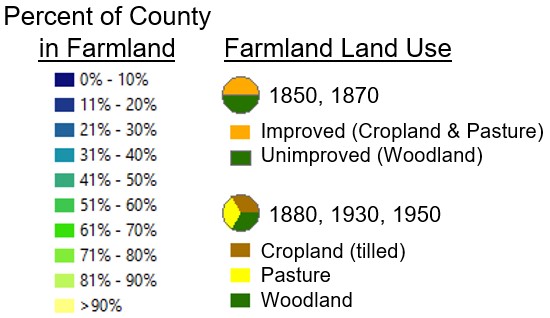
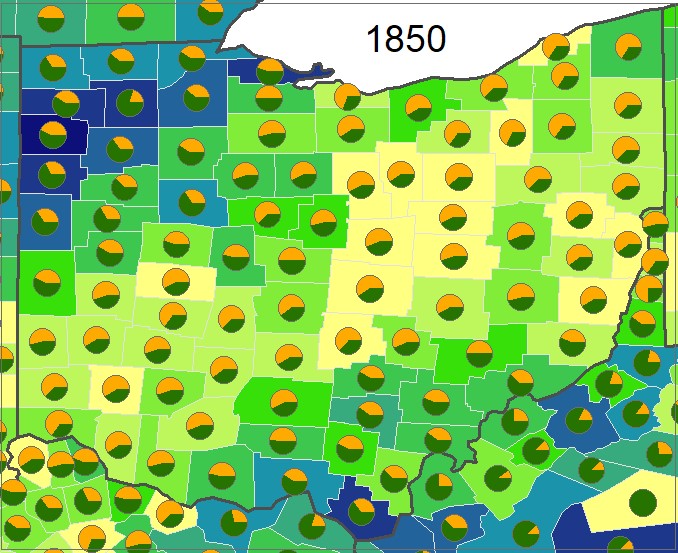
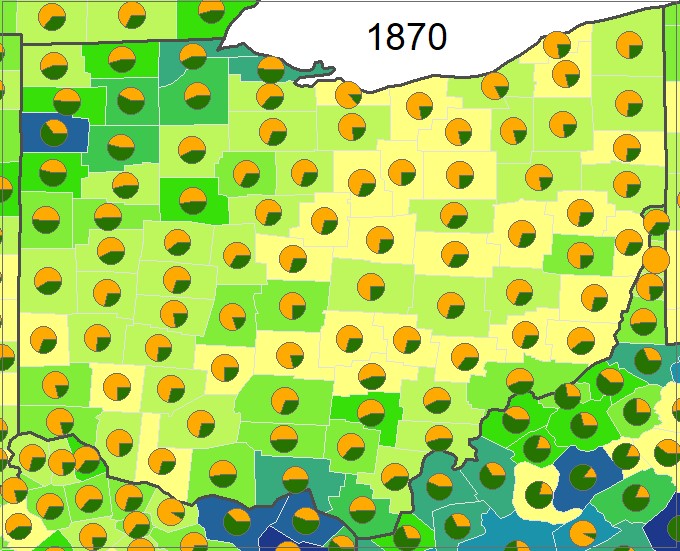
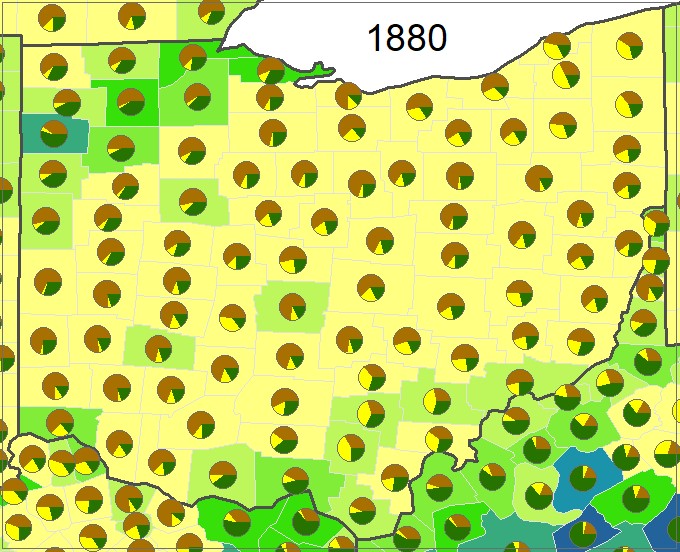
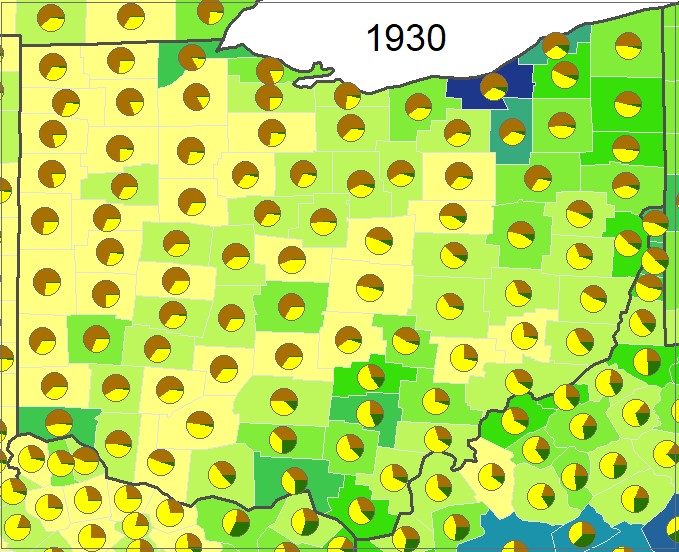
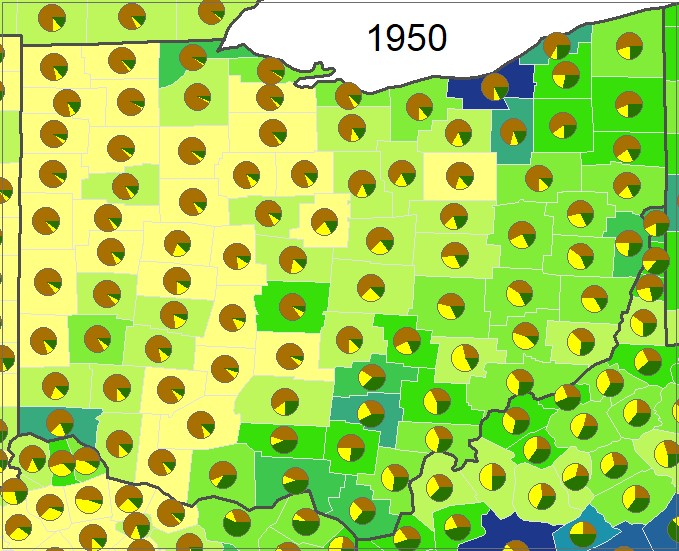
Series 2: Ohio - Percent of
county in farmland, and farm land use
Series 3: New England -
Percent of county in farmland, and farm land use
Last updated May 2020
Back to Main Page