Problem 10.6 - Cooling Tower for the Cogeneration System for Ohio University
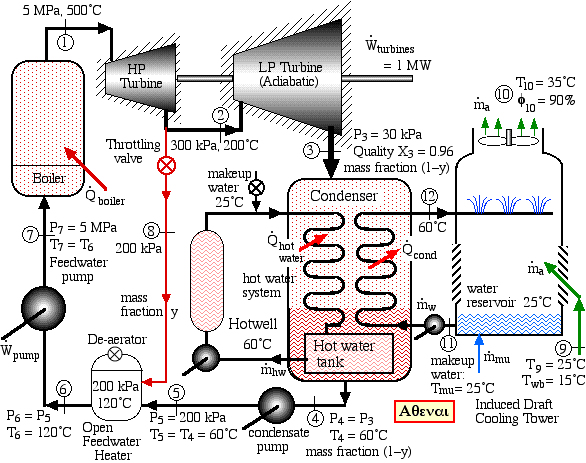
Recall Problem 8.2, in which Athenai Power Consulting proposed a cogeneration system for Ohio University to provide both 1 MW electric power and hot water at around 60°C. The Athens City Council was somewhat perturbed at the large possible flow rate of water to the Hocking river heated by 10°C, thus Athenai decided to evaluate using an induced draft cooling tower, as shown in the following schematic diagram:
Notice that the condenser cooling load is shared between the hot water heating system and an induced draft cooling tower, thus the cooling tower circulating pump can be controlled as needed based on the hot water heating requirement.
a) Neatly sketch the complete power plant cycle on the P-h diagram provided, indicating clearly all the stations (1) through (8) on the diagram. Using the Steam Tables determine the enthalpy values at each of the stations. Indicate the values obtained on the P-h diagram and check them for feasibility.
b) Determine the mass fraction y of the steam bled from the outlet of the HP turbine at station (2) in order to heat the water in the de-aerator to 120°C. [y = 0.097]
c) With the required turbine power output of 1 MW determine the mass flow rate of the steam [1.15 kg/s]. Note that the steam mass flow in the LP turbine is reduced by the mass fraction y.
d) Determine the increase in enthalpy across the feedwater pump [Δh = 5.09 kJ/kg], and use this value to determine the entalpy at station (7) [h7 = 508.7 kJ/kg] as well as the power required to drive the feedwater pump [5.85 kW].
e) Determine the overall thermal efficiency of this power plant [ηth = 30%]. (Recall that thermal efficiency is defined as the net work done (turbines + feedwater pump) divided by the total heat supplied externally to the boiler.)
f) Determine the cooling power in the condenser required to condense the steam exiting the turbine at station (3), and to subcool the condensed steam to 60°C at station (4) [-2368 kW]. (Note that this is the maximum power that can be used by the hot water heater)
g) Given the typical conditions shown on the diagram determine the maximum hot water flow rate that this system can produce, when the cooling tower circulating pump is switched off [16.2 kg/s].
h) Given the conditions at stations (11) and (12) determine the maximum condenser cooling water flow rate required in order to condense and subcool the steam as shown when the hot water circulating pump is switched off [16.2 kg/s].
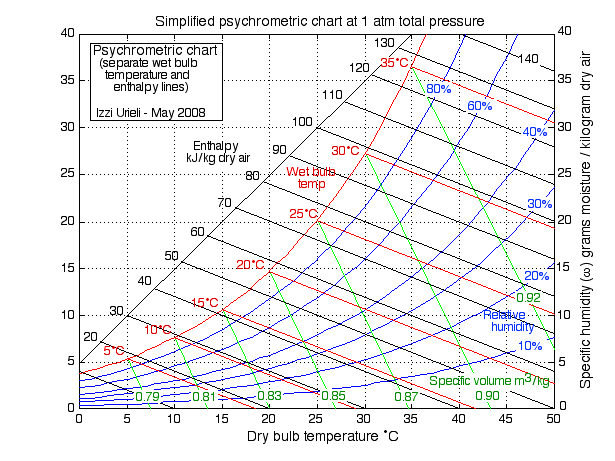
i) In the lull period when no water heating is required, then the induced draft cooling tower will need to cool the coolant by evaporation from a maximum of 60°C at station (12) to 25°C in the water reservoir (station (11)). With the aid of a Psychrometric Chart provided below determine the mass flow rate of the dry air through stations (9) - (10) [33.2 kg/s], as well as the mass flow rate of the makeup water from the Hocking river [0.85 kg/s]. Determine also the volumetric flow rate of the humid air at station (10) [30.4 m3/s]. Clearly mark and label the relevant values on the Psychrometric Chart, including the values of enthalpy (h), relative humdity (φ) and specific humidity (ω) of stations (9) and (10) respectively.
j) Discuss the proposed system with respect to its environmental impact and feasibility, and compare this approach to the previous proposed system shown in Problem 8.2.
Justify all values used and derive all equations used starting from the basic energy equation for a flow system, mass flow rate equations similar to those developed in Chapter 10c, and the basic definition of thermal efficiency (ηth).
 ______________________________________________________________________________________