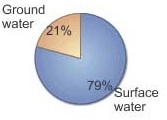
Surface WaterOnce precipitation reaches the surface, water can infiltrate into the soil or move across the surface as runoff. Surface runoff generally occurs when the rainfall intensity exceeds the rate of infiltration, or if the soil is at its water holding capacity. Infiltration and water holding capacity are both a function of soil texture and structure. Soil composed of a high percentage of sand allows water to infiltrate through it quite rapidly because it has large, well-connected pore spaces. Soils dominated by clay have low infiltration rates due to their smaller sized pore spaces. However, there's actually less total pore space in a unit volume of coarse, sandy soil than that of soil composed mostly of clay. As a result, sandy soils fill rapidly and commonly generate runoff sooner than clay soils.
If the rainfall intensity exceeds the infiltration capacity of the soil, or if the soil has reached its field capacity, surface runoff occurs. Water runs across the surface as either confined or unconfined flow. Unconfined flow moves across the surface in broad sheets of water often creating sheet erosion. Confined flow refers to water confined to channels. Stream flow is a form of confined flow. Water that runs along the surface may become trapped in depressions and held as depression storage. Here water may either evaporate back into the air, infiltrate into the ground or, spill out of the depression as it fills. Stream flow is measured in a variety
of ways, one of which is stream discharge. Stream discharge
is the volume of water passing through a particular cross-section of a
stream in a unit of time. Stream discharge is measure in cubic feet per
second or cubic meters per second. The "normal" or base flow a stream
is provided by seepage of groundwater into the stream channel. This
seepage is what keeps perennial flowing streams going all year. When
precipitation from a storm occurs, the stream discharge increases as
water is added to the stream, either from direct precipitation into the
channel or runoff.
Figure 10.14 A stream hydrograph A stream hydrograph (right) illustrates the relationship between discharge and runoff. The blue bar graph is precipitation and the line graph represents discharge. As time passes (measured along the x-axis) discharge increases as precipitation falls. Notice that the time of peak precipitation occurs before peak discharge. This is because it takes time for the water to flow across the surface and enter the stream.
The size, shape, land use, vegetation, and geology of the watershed all determine runoff and the shape of the discharge graph.
Surface water is an important source
of water supplies, especially in the southwestern United States. Ever
increasing population and development is straining regional water
resources. As the Colorado River winds its way through the desert it
loses half its flow to evaporation and the rest to irrigation and municipal water supplies. Recent drought
and warmer temperatures predicted in the future will put a greater demand on this precious commodity. The lower course rarely reaches the Gulf of California as it Figure 10.* The now-dry Colorado River delta lies in the Baja/Sonoran Desert 5 miles north of the Sea of Cortex, Mexico (Courtesy USGS)
Some feel that we have reached maximum extraction rate for oil. In other words, we have reaches "peak" in our ability to extract oil and the rate of production will continue to decline. Can the same be said for our use of water? View the video below to explore the answer to this question. View "Peak Water" from Wired Science
Assess your basic understanding of the preceding material by "Looking Back: The Hydrologic Cycle" or skip and continue reading. |
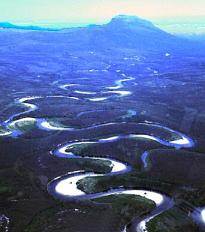 Figure 10.13 Meandering stream
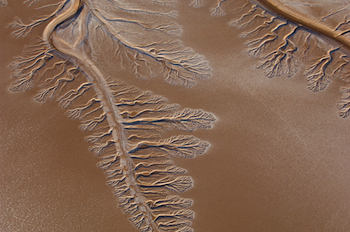 did in times past. Now this once might river usually ends as a small stream or dry channel.