Synoptic Scale FrontsAt a smaller or synoptic scale are the "weather" fronts e.g., cold, warm, occluded, and stationary. Cold fronts are those where cold air replaces warm air. A warm front is where warm air replaces cold air. A noticeable difference between warm and cold fronts is the slope of the front above the surface. The frontal surface, the portion extending upward above the surface, is much steeper for the cold front than warm front. The steepness of the frontal surface directly impacts the type of weather one experiences along these fronts.
An occluded front forms when a cold front catches up with a warm front. Air is often converging at a front producing a trough of low pressure along it. A decrease in pressure is often experienced with their passage. A stationary front is where no change in air masses or movement of the front occurs. The weather associated with these fronts is discussed later. Weather Map DepictionMeteorologists use both symbols and color to distinguish between synoptic scale fronts on weather maps. If printed in color, warm fronts are shown as a line of red semi-circles pointing in the direction of movement. Cold fronts are depicted as a line of blue triangles. Occluded fronts appear in purple with both warm and cold front symbols on the same side. The symbols point in the direction of the front is moving. Stationary fronts are alternating warm and cold front symbols on opposite sides, indicating no movement. A portion of a simplified weather map is shown in Figure 8.5. The map depicts a wave cyclone as it is starting to occlude. We see an occluded front trailing southeast from the center branching into cold and warm fronts.
The location of air masses on weather maps are identified by their letter abbreviation, e.g., mT, cP, mP. Shading is used to show where areas of precipitation occur. Looking at the local environmental setting can give a clue as to what mechanism caused uplift for precipitation to form. Note that the areas of precipitation in Figure 8.5 either occur ahead of a front (frontal lifting) or to the north of the center of the low (convergent lifting).
The distribution of air pressure is shown by isobars, lines connecting points of equal air pressure. Isobars are drawn in increments of 4 millibars on surface weather maps. Recall that it is the pressure gradient that controls wind speed. Strong pressure gradients and hence faster winds occur where the isobars are closely spaced. Weak pressure gradients and slow winds occur where the isobars are widely spaced.
Check your understanding of the preceeding material by "Looking Back: Air Masses and Fronts" or skip and continue reading. |
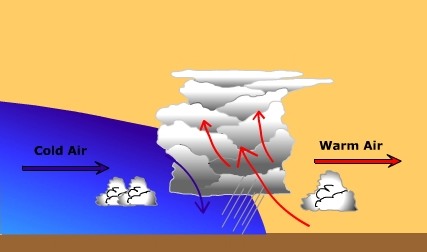
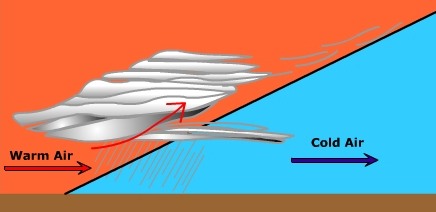
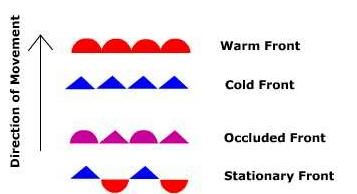
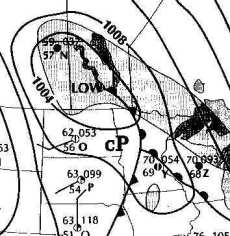 Figure 8.8 Simplified Weather Map