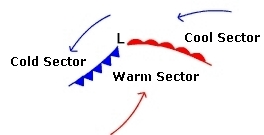
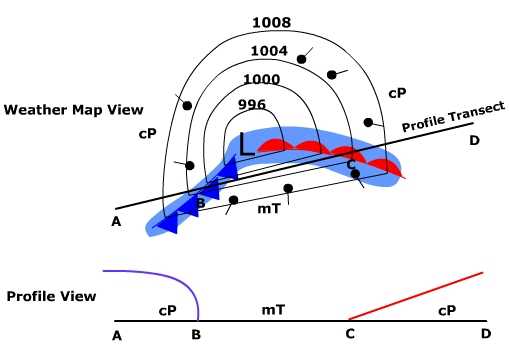
Weather and Wave CyclonesThe weather associated with the passage of a wave cyclone is a product of the convergence and frontal uplift found in the system. The wave cyclone can be divided into three sectors: (1) the cool sector ahead of the warm front, (2) the warm sector between the cold and warm fronts, and (3) the cold sector located behind the cold front (Figure 8.15). During the spring, summer, and fall, cP air masses tend to occupy the cold and cool sectors while an mT air mass lies in the warm sector. The cold sector generally has the lowest temperatures as cold air is coming from a northerly direction. Air in the cool sector is coming from an easterly direction so it is warmer than the air in the cold sector. In the warm sector air is entering the system from the south so we should expect to find the warmest temperatures in this region. In the next few sections we'll examine the weather associated with the various sectors and fronts. Weather patternsFigure 8.16 illustrates two views of a wave cyclone, the top portion is a weather map view looking down on the system from above. The bottom portion shows a simple profile (side) view along the line identified as the "Profile Transect" that connects points A, B, C, D on the weather map view.
Figure 8.16 Two views of a wave cyclone Let's examine the weather map view first. Isobars have been constructed to show the distribution of pressure around the cyclone. Notice that the lowest pressure is at the center of the system and increases outward. Another thing to note about the isobars is the V-shape where they cross the fronts. This indicates that the front sits in a trough of lower pressure. As a front approaches you will experience a drop in atmospheric pressure. Once a front has passed the pressure will increase. The flow of air around the system is indicated by the wind direction symbols (black dots with a line pointing in the direction of the wind). The symbols show the characteristic counterclockwise flow around a center of low pressure in the Northern Hemisphere. Ahead of the warm front, in the cool sector, the air is from an easterly direction. In the warm sector, mT air streams out of the south. Behind the cold front air comes from a westerly to northwesterly direction. The light blue area shows the distribution of precipitation. Notice there is a larger band of rain along the warm front than along the cold front. |