Color II


 Color Mixing by Addition
The three primary
colors of light are:
and
Test Image
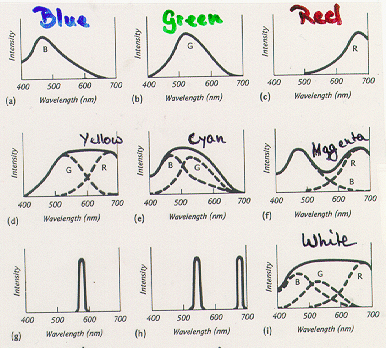
Intensity distribution curves in additive color mixing
 Intensity distribution curves of
Additive Mixing of Colors
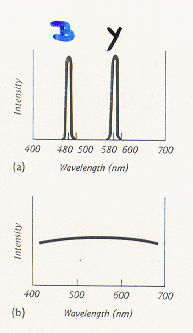
Thus, blue and yellow are colors complementary to each other. Similarly,
because we can think of cyan as being the same as blue and green mixed
together: It does not matter to your eye, whether the intensity distributions are broad or monochromatic. if two colors are complementary, their additive mixture is white.


To find the complement of a given wavelength, say Notice, that there are no complementary monochromatic colors for the greens (roughly between 495 and 565 nm). This is because the complement of green is a nonspectral magenta, a double humped intensity distribution, a combination of red and blue. This gives a way to describe the nonspectral purple hues by wavelength, namely the wavelength of their complements. For example, one can speak of magenta 535c , meaning a color that gives white when added to 535 nm green.
Wavelengths of complementary pairs of monochromatic colors. To find the complement of a given wavelength, say 600 nm, draw a horizontal line form the 600 nm mark on hte vertical axis. Find the point where this line intersects the curve and drop a vertical line from that point to the horizontal axis to determine the wavelength of the complement, 489 nm. Thus the complement of orange (600 nm0 is bluish cyan (489 nm).
Different additive combinations of blue, green, and red lights produce yellow, cyan, magenta, and white. This suggests that on might be able to produce any color as an additive mixture of three properly chosen lights.
Pick 3 Monochromatic Colors:
Red (650 nm), Green (530 nm), Blue (460 nm).
Notice that the required amounts of read and green colors are zero at 460 nm. This is because one can match 460 nm using only the 460 nm blue. The relative amount of the blue, then, is 100% at that point. Similarly, the blue and red amounts vanish at 530 nm, while the blue and green vanish at 650 nm. Consider
The best cyan one can make from blue and green lights will not be as saturated as monochromatic cyan. Thus one has actually
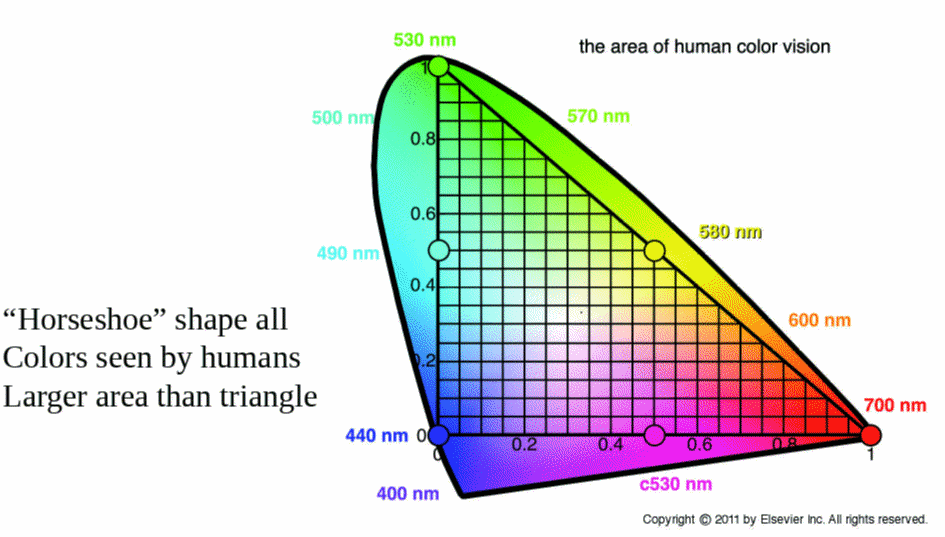
If one treats this as mathematical equation, one can rewrite this expression as That is, when one allows negative amounts, one can match monochromatic cyan. In fact, if we allow negative contributions, one and match any color, no matter how saturated. Thus, the above figure allows negative amounts of the three monochromatic colors. The curves give the relative amounts, the fractions of the total. The three relative amounts must add up to 1 at each wavelength. This means that if we know any of the two of the curves, we can figure out the third. One can plot these ratios in a different way, the Horseshoe Diagram or Chromaticity Diagram
The horseshoe curve shows the locations of the spectral color to be matched. To use this, pick a spectral color to be matched, find its location on the horseshoe curve, and read off (by reading down) the amount of read and (by reading across) the amount of green. The amount of blue is determined by subtracting the sum of the green and read from 1.00. On this diagram the rules for additive mixtures are easily expressed

TV Technology: Additive and Subractive Color Mixing
 Ways of mixing
color by addition Ways of mixing
color by additionThere are many different techniques for mixing colors additively, and the chromaticity diagram rules apply to all of them.
 Simple addition Simple additionSimple additive mixing occurs whenever two different light sources illuminate the same region, e.g., when light from the blue sky coming through the window and the yellowish light from an incandescent lamp fall on a piece of paper. Since both lights enter your eye together, they add to each other. Such mixtures are extensively used in stage lighting. The first color photographs were projected using three projectors in register, one for each of the additive primaries. The same technique is still used in large-screen color TV projection such as in sports arenas and home projection systems. There the TV projector consists of three different mirror or lenses that project enlarged images, in register, of three small very bight picture tubes, each of which contains the TV image in one of the three additive primary colors.
 Partitive mixing Partitive mixingAnother way of enabling lights of different colors to mix is to place small separate sources close to each other. If your eye cannot see them as separate sources, their colors will mix additively. This type of additive mixing is called partitive mixing. This is the way an ordinary color TV picture is produced. (Close-up of a color TV screen, showing the additive primary phospors.) There is one picture tube with three electron guns in it, The electrons from different guns are directed to different points on the screen by a mask with many holes. The screen consists of dots of three different phospors, each of which will produce one of the additive primary colors. The dots are arranged so that each type can be hit through the mask by only one of the guns. Each gun makes a complete TV picture in one of the primary colors, but the pictures are tightly interlaced on the screen, so you do not see them individually. Instead you see their additive mixture, the full color picture.
Try it! Partitive mixing.
|

Ch. Elster