Climate Systems
Digging Deeper: Permafrost and Climate Change
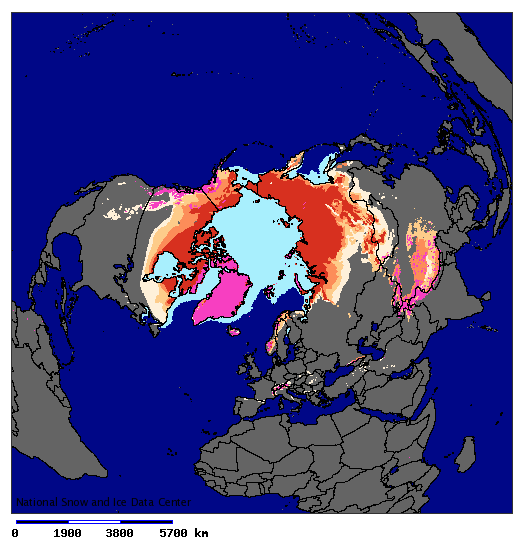
As discussed in Chapter 3, surface features and human activities play are role in the composition of earth's atmosphere. Permafrost currently covers 24% of the exposed land in the high latitudes of Northern and Southern Hemispheres. Climate change scientists are carefully watching the impact of global warming on the seasonally and permanently frozen soil of the Arctic and subarctic.
 
Figure DD9.* Northern Hemisphere Permafrost
Courtesy National Snow and Ice Data Center (Source)
The estimated maximum extent of seasonally frozen ground in non-permafrost regions has decreased by approximately 7% in the Northern Hemisphere, with up to 15% decrease during the spring. Degradation of permfrost appears to be resulting from increased summer air temperatures and changes in snow depth and duration. The active layer of permafrost measured at over 30 stations in Russia between 1956 to 1990 exhibited a 21 cm deepening. Records are too short in other parts of the world to show any kind of trend in active layer deepening.

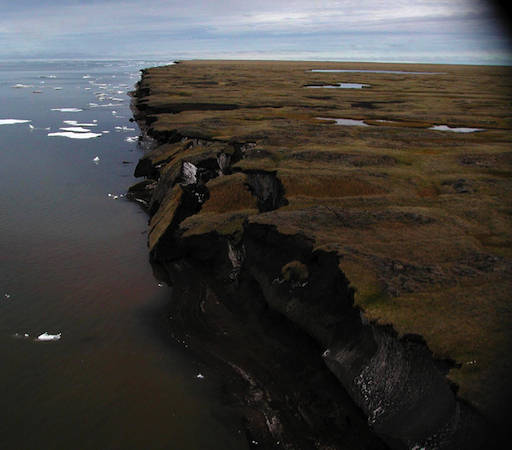
Figure DD9.* Crumbling coastline from melting permafrost at Drew Point, Alaska
Courtesy USGS (Source)
Results from a variety of IPCC climate scenarios point to a likely decline in the area of Northern Hemisphere permafrost of 20 - 35% by the mid-21st century. An average seasonal depth of thawing is expected to increase by 15-25% by 2050 and 30-50% over most permafrost regions.
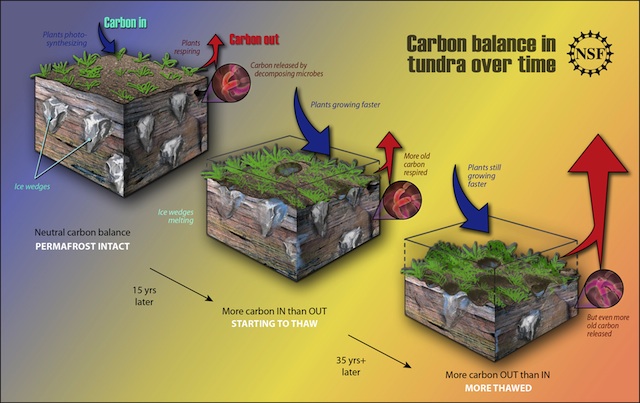
It is estimated that northern circumpolar regions store twice the amount of carbon that is held in the atmosphere as CO2. As frozen soils thaw under warmer conditions, carbon dioxide, methane, and nitrous oxide is released into the atmosphere. Most of this is a product of the decomposition of organic matter that has built up over many years under colder temperatures. Warmer temperature in Arctic and subarctic ecosystems has created longer growing seasons, stimulating plant growth, resulting in increasing carbon emissions. It is expected that carbon emissions will eventually exceed that of storage and encouraging further warming.

Figure DD9.* Carbon Balance in the Tundra Over Time
Courtesy Zina Deretsky, National Science Foundation (Source)
Click image to enlarge
Previous
|
