Map Scale
Map scale is the relationship between distance on a map and distance in the real world. There are several ways to specify map scale. Often we find the scale of a map expressed in words like, "one inch equals one mile". You’ve most likely seen map scale depicted with a graphic, like a bar divided up into segments. The length of a segment represents some distance on the earth. We can specify scale as a representative fraction as well. These fractions often appear as follows:
1:24000
The fraction means that one unit of measurement on a map represents 24000 units in the real world. It’s important to remember that the same units of measurement are on either side of the colon. That is, 1 inch represents 24000 inches, or 1 centimeter represents 24000 centimeters. To calculate the distance between two points, one simply measures the map distance and multiplies it by the number of "real world" units. For example, if the measured distance between two points on a map with a scale of 1:62500 is 2.4 inches, then the real world distance is 2.4 times 62500 or 150000 inches. It’s hard to think how far that really is so convert it to miles. To do so simply take 150000 and divide by the number of inches in a mile which is 63360. So, the distance between the two points is about 2.37 miles.
Scale Categories
Map scales are grouped into small, medium and large categories. Large scale maps, such as 1:24000 scale maps show a smaller area in great detail. They are useful for showing the locations of buildings and other features important to engineers and planners. Medium scale maps, (1:62500) are good for agricultural planning where less detail is required. Small scale maps have the least detail but show large areas. These are useful for extensive projects at regional levels of analysis. You can easily see the impact of map scale on the information in figures 1.22a through 1.22c below.
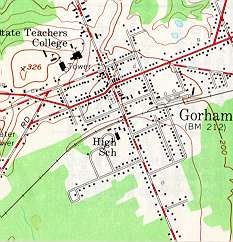
Figure 1.22a (Source: U.S.G.S. |
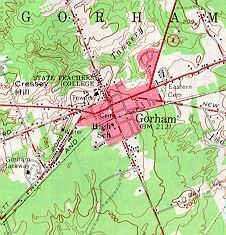
Figure 1.22b (Source: U.S.G.S |
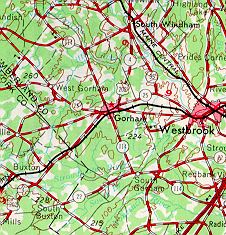
Figure 1.22c (Source: U.S.G.S. |
Concept Check
Notice in Figure 1.22a (above) that black squares have been used to depict individual buildings in the downtown of Gorham. Why hasn't this been done in Figure 1.22c?
Enter your answer in the text
box below and click the submit button.
