Water
Balance Toolset (v.3) for ArcGIS
James
Dyer
Professor of
Geography

A water balance (or budget) explores the interactive relationship
between energy and moisture at a place, by modeling moisture
demand (potential evapotranspiration) and supply (precipitation
and soil moisture storage). The Water Balance Tool consists
of a suite of ArcGIS Toolboxes that generate all monthly water
balance grids for a study site, enabling a “pixel-by-pixel”
assessment across the study area. It can be run for a single
year, or any number of consecutive years (provided climate and
radiation data are available). This current version was
created with ArcGIS Python Toolbox, and is compatible with ArcGIS
v. 10.2 and later. A python toolbox is a single python file
with the .pyt extension, containing one or more tools that can
interact with each other. The user can run individual tools
independently, or run an automated tool that sequentially executes
the different steps (including the downloading of input
data). All tools include a simple user interface.
The water balance model is presented in the following article:
Dyer, J.M. 2019. A GIS-based water
balance approach using a LiDAR-derived DEM captures fine-scale
vegetation patterns. Remote
Sensing 11(20): 2385.
https://doi.org/10.3390/rs11202385
Archived web pages are still available for version 1 and version 2 of the model.
Downloads (refresh your
browser to see any updates):
- User
Manual, PDF format. Note: "Step 1" of the
Automatic Run tool automatically downloads and prepares input
grids, but changes to server configuration since the code was
written have affected this ability. Click here for Manual
workarounds to Prepare Input Data.
- Water Balance
Toolset for ArcGIS v.3, Zipped file. NOTE: As explained in the User Manual (Section
3.2), ArcGIS v. 10.5.1 crashes when
computing PET, since this version is unable to
perform a necessary calculation on solar grids stored in
multi-band tif format. The Water
Balance Tool successfully executes on ArcGIS v. 10.2, 10.3,
10.4, 10.6 and 10.7 (i.e., all other versions as of April
2019).
- Note: Changes on the Web Soil Survey
server have apparently resulted in errors in the soil AWC
grid downloaded by the Water Balance Tool (soils_awc.tif
having only “0” values, and soils.tif having astronomically
large Low/High values). Users can follow these
steps to create the necessary soils AWC grid to run
the Water Balance Tool.
- Demo,
Zipped file containing instructions and shapefiles for Fernow
Experimental Forest, WV. Extract the folder "Fernow" to
your computer's hard drive. This folder contains the
file "WB_Demo.pdf" with instructions for running the demo. You
will also need to download the Water Balance
Toolset.
- Demo version
2, with input data downloads already completed,
Zipped file containing instructions and shapefiles for Fernow
Experimental Forest, WV, as well as all input data from
running "Automatic Run Step 1." Extract the folder
"Fernow" to your computer's hard drive. This folder
contains the file "WB_Demo.pdf" with instructions for running
the demo. You will also need to
download the Water Balance Toolset.
Version History:
3.0.2
June 2019 Fully implemented radiation
parameter change from v.3.0.1; tool
descriptions reinserted.
3.0.1 May 2019 Solar
Radiation parameter changed from default "Uniform_Sky" to
"Standard_Overcast_Sky."
Jump to: Adjusting monthly PET grids
created by the Water Balance Toolset to account for diurnal
temperature patterns.
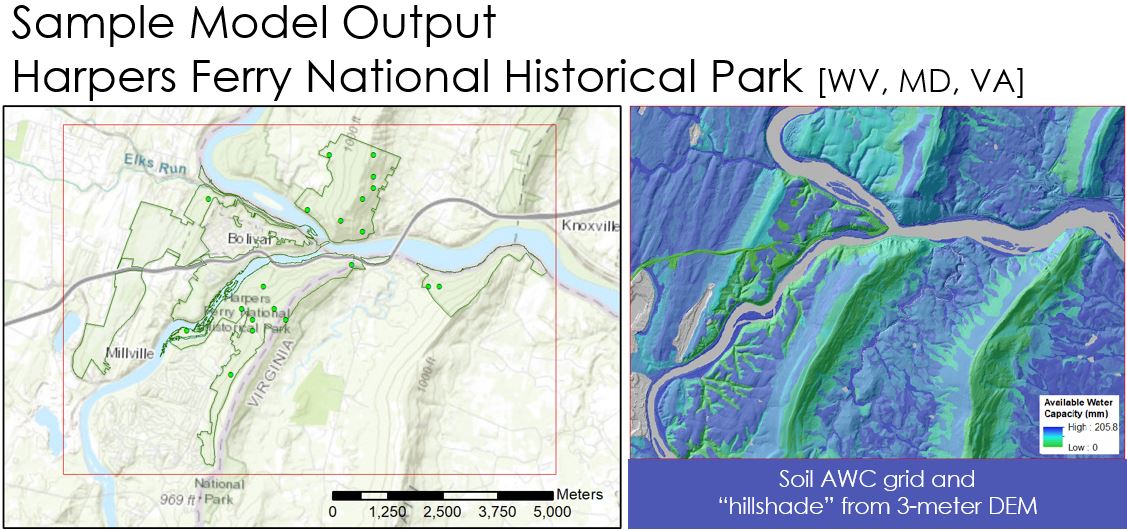
Available Water Capacity (AWC), which
represents soil moisture storage
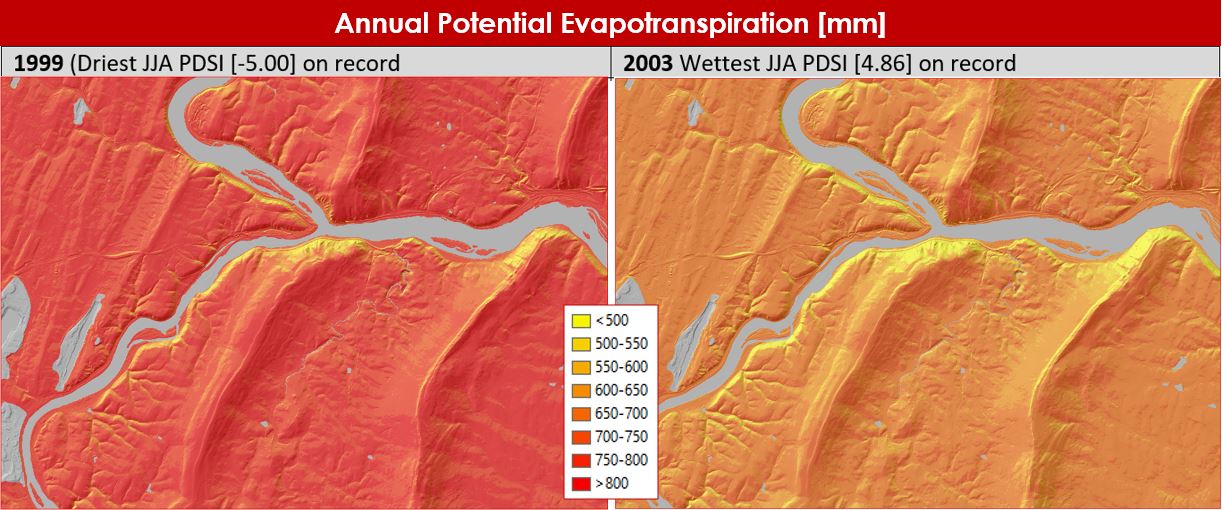
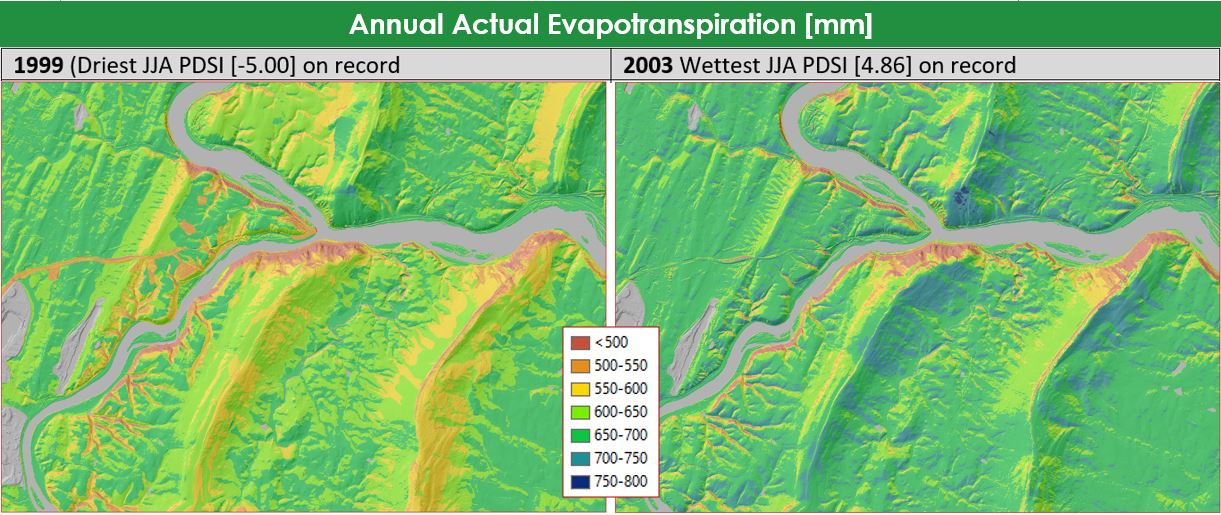
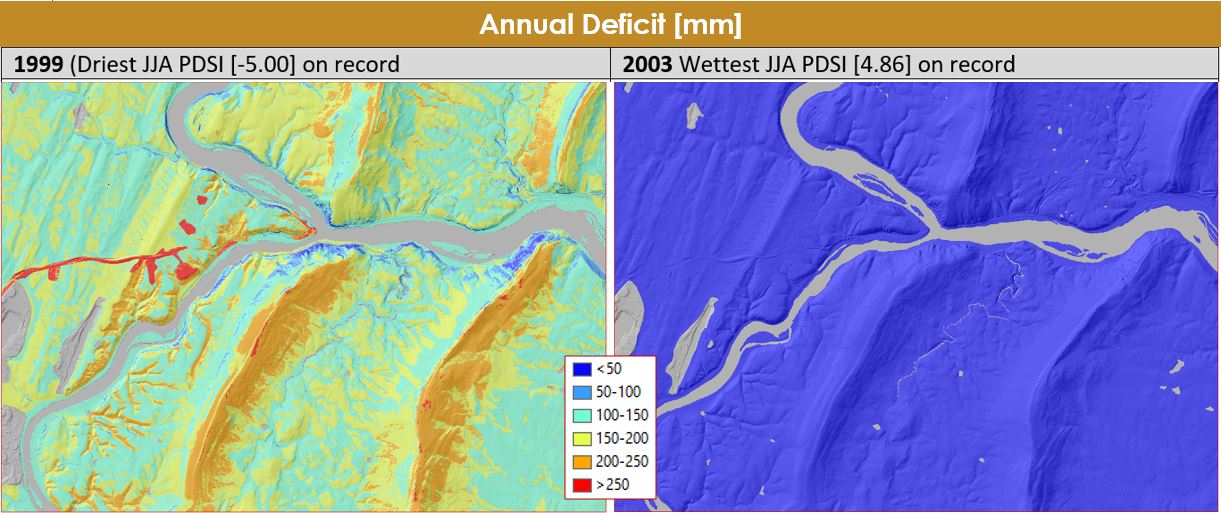
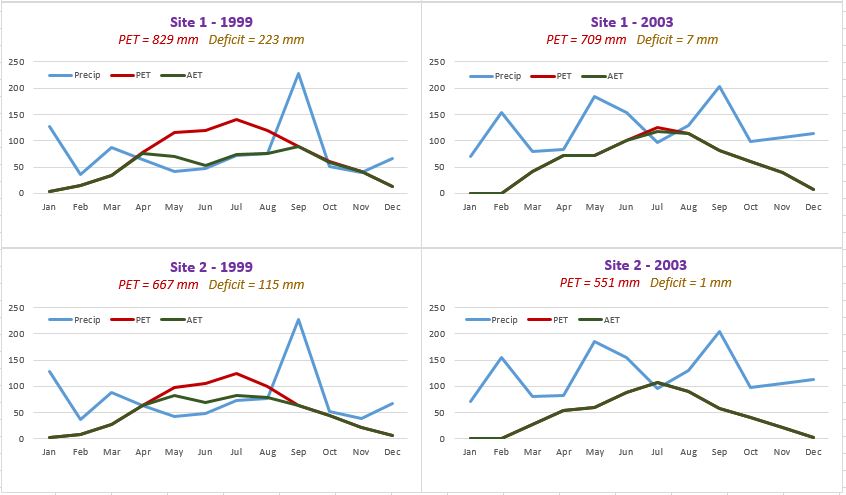
The following grids compare two years that experienced very
different June-July-August values of the Palmer Drought Severity
Index (PDSI Source: NOAA)
Potential
Evapotranspiration represents moisture demand, and is a
function of heat and radiation. It is the evaporative
water loss from a vegetated surface in which water is not a
limiting factor.
Actual evapotranspiration refers to
water loss from a vegetated surface given water availability (that
is, precipitation and soil moisture storage).
Deficit represents
moisture stress, and occurs when evaporative demand is not met
by available water. In other words, it is the difference
between potential and actual evapotranspiration.
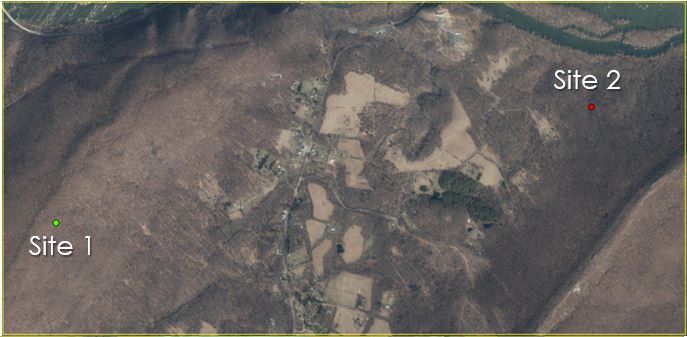
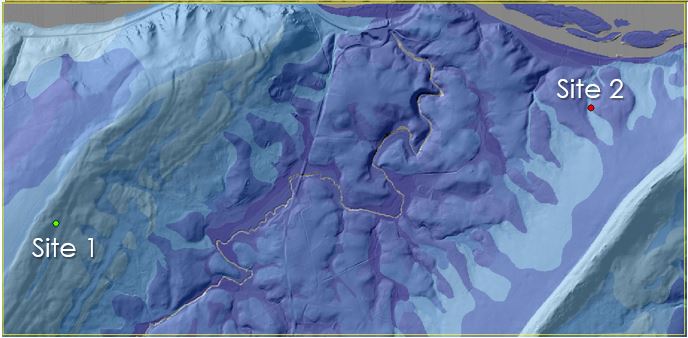
The tool enables
extraction of monthly water balance values to points. Note
the difference in values at a site between years, and the
difference between nearby points within the same year.
Site 1 and 2 are 3.6 km apart. Site 1 is on a
southeast-facing ridge, available water capacity = 47 mm.
Site 2 is situated in a northwest-facing valley, available water
capacity = 83 mm.
The water balance tool computes monthly potential
evapotranspiration using the Turc method. The tool then computes
soil moisture storage, actual evapotranspiration, soil moisture
deficit, and soil moisture surplus for every grid cell within a
DEM, using the Thornthwaite-Mather approach. Data needs for
performing a water balance using GIS are few: a digital elevation
model (DEM), soil available water capacity (AWC), and monthly
temperature, precipitation, and solar radiation. In
“automatic run” mode, the tool can download and prepare all input
data, but user-provided data or grids may also be used.
If you use this model in your research, please acknowledge the
source and cite the original publication (provided above).
The Water Balance Tool was developed by James Dyer; Steve Porter
automated the tool using Python scripting. Funding to
automate the tool was provided by the National Park Service under
Cooperative Agreement P14AC00882. The User Manual and Demo
were written by James Dyer. Suggestions, corrections, or
comments can be directed to dyer@ohio.edu.
Adjusting monthly
PET grids created by the Water Balance Toolset to account
for diurnal temperature patterns. To model moisture demand
(potential evapotranspiration), the Water Balance Tool
considers temperature and radiation using a monthly time
step. Since diurnal variations in temperature are not
considered, maximum demand occurs on southern exposures (in
the northern hemisphere), since that is where maximum
insolation occurs (and potential evapotranspiration is
symmetrical about the N-S axis). Yet typically, higher
PET is associated with more westerly aspects because
temperatures are warmer in the afternoon when these aspects
are receiving the most direct radiation. For this
reason, an (optional) method has been developed to
create “PET adjustment coefficients.” Essentially, daily
PET is calculated for a representative day each month using an
hourly time step, and this is compared to daily PET derived
using average daily temperature. Differences in the two
approaches allow a pixel-by-pixel adjustment to PET values
created with the monthly time step. By factoring in
diurnal temperature differences, higher monthly PET values can
occur on western aspects compared to their eastern-aspect
counterparts. (See sample images below.) However, the
approach has not been fully automated, and is
time-consuming. It is presented here for users who wish
to explore these adjustments. Instructions and necessary
ArcGIS toolbox available here
(zipped file).
Differences in Adjusted vs. Unadjusted
PET, Annual Values:
Last updated April 2021
Back to Main Page