Previous Next
The 1983 Nobel Prize in Physics was shared by two astrophysicists, Subrahmanyan Chandrasekhar and William A. Fowler. This section concentrates on Fowler's nuclear astrophysics. Our primary focus (!) will be Fowler's work on stellar nucleosynthesis, but we will touch briefly on the solar neutrinos that are produced as a byproduct of energy generation in the sun.
Hydrogen, helium, and lithium were formed, at least in part, during the "Big Bang," but (in large part as a result of Fowler's work and the work it has inspired) it is now clear that all other nuclei were synthesized in stars and dispersed in the explosions at the ends of their lives, except for the rest of the lithium and for the beryllium and boron, which were produced from those heavier elements by cosmic ray bombardment in the regions between stars. This is established by calculations modeling the interior structures (temperature, pressure, and composition as a function of radius) of many types of stars, and the changes in those quantities over time as the star burns up its nuclear fuel. The results of those calculations are first, predicted relative abundances of the various possible nuclei, and second, predicted fluxes and spectra of neutrinos bombarding the earth.
Fowler was probably the dominant individual in defining the discipline of nuclear astrophysics. After more than fifteen years of nuclear physics research at the Kellogg Radiation Laboratory of Caltech (he came as a graduate student in 1933, working under Charlie Lauritsen) Fowler began in about 1950 to concentrate his study on the particular nuclear reactions believed to take place in the sun. By accurate experimental measurements of the energy levels of the various states of the nuclei involved and the reaction rates for the various individual processes, Fowler and his colleagues have thoroughly limited any theory proposing to explain the structure and evolution of stars, stellar nucleosynthesis, etc..
- Abundances of the Elements
The observational data on the abundance of the elements that need to be explained include Fig. 7, which is redrawn from the historic 1957 paper by E. Margaret Burbidge, Geoffrey Burbidge, William A. Fowler, and Fred Hoyle, "Synthesis of the Elements in Stars." The figure is based on the data of Suess and Urey, 1956 (a 21 page article in Reviews of Modern Physics) on the relative abundances of the elements.
"Schematic curve of atomic abundances as a function of atomic weight [...] Suess and Urey have employed relative isotopic abundances to determine the slope and general trend of the curve. There is still considerable spread of the individual abundances about the curve illustrated, but the general features shown are now fairly well established. [...] Note the overabundances relative to their neighbors of the alpha-particle nuclei, A = 16, 20 ... 40, the peak at the iron group nuclei, and the twin peaks at A = 80 and 90, at 130 and 138, and at 194 and 208."
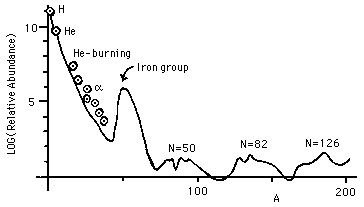
Figure 7: Relative Abundances of Elements by Atomic Mass Number
Observe the logarithmic scale for abundances in Fig. 7. Helium burning and alpha addition have different sources for the alphas. There are two sets of problems that need to be addressed: how are nuclei created that have masses between 4 and about 60, and how are those more massive than 60 created? The problem at high masses can be understood in terms of Fig. 1, which shows the binding energy per nucleon for the most stable nucleus of each atomic mass as a function of that mass.
The most stable configuration of nucleons is in nuclei of mass near 60; any nucleus of mass greater than about 100 can exothermically fission, and in a sufficiently hot environment will. Shurtleff and Derringh (1989) show that Ni-62 is slightly more tightly bound per nucleon than Fe-56, but Fe-56 is much more common because of the detailed synthetic pathways available to create it, compared to those available for Ni-62, in the stellar interior. (Most of the Ni-62 is created in nova and supernova explosions.)
It requires a detailed understanding of the radial temperature profile inside of various stars throughout their lifetime, and of the various nuclear reactions involved, to be able to select among theories on the origins of the heavy elements. The basic mechanism creating them can be described as single nucleon absorption, usually a neutron at a time, but sometimes a proton, typically releasing the binding energy of the new nucleon as a gamma ray and then later when necessary undergoing beta decay to attain the most stable nucleus of the new mass. Because the nucleon absorption probability depends strongly on energy (and therefore on temperature), a large mass of experimental data must be obtained and organized for useful evaluation of stellar models. This has been a major contribution of the Kellogg Radiation Laboratory at Caltech.
- Low Mass Elements
The problem at low masses is that the single-nucleon addition founders on the absence of any stable nuclei with mass equal to 5 or to 8. Li-5 and He-5 are both so unstable that CRC (66th Ed.) does not even list a lifetime. As seen in Eq. 2, below, the obvious mass 8 nucleus, formed from the fusion of two alpha particles, is Be-8, which is unstable. It decays, exothermically, of course, with a mean life of 0.1 femtoseconds, yielding about 46 keV/Be-8 nucleus = 1 million kcal/mole. But even worse, it decays back to two alphas:

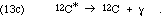
The mass 8 problem is especially awkward because the conventional burning of hydrogen to helium is accomplished with the aid of C-12, N-14, O-16, and O-17, which can only be formed in adequate quantities through such processes as

In general, once mass 8 nuclei are synthesized, alpha particles are added successively, up perhaps even to Ti-48, forming the nuclei of mass 4n, and single nucleon absorptions "fill in the gaps." In some cases the actual dominant process is 4m + 4n  4(m+n) or 4(m+n-1) + alpha.
The resolution of the mass 8 difficulty requires application of the thermodynamics of chemical equilibrium. Even though reaction (11) is very strongly exothermic, so that any Be-8 that forms promptly decays, there is still a non-zero concentration of Be-8, resulting from the reverse reaction to reaction (11), produced by the random collisions of two He-4 nuclei. Therefore, we should write the reaction as a bi-directional, equilibrium:


forming the excited C-12 nucleus, which then often relaxes to its ground state by gamma ray photon emission:
Are there other reactions we should consider? The C-12* excited state has been seen to decay into three alphas, so we should consider the possibility of another reaction, in which three alphas collide to form C-12* directly (instead of the two-step accretion process of reaction 13). This direct formation reaction is ruled out by inference from the decay products' observed kinetic energy spectra. By the conservation of momentum in each decay event, any partition of the energy is possible when there are three products at once, but only one partition is possible, as seen in the center of mass frame, for a two product decay. These ideas were previously discussed in connection with Figs. 5 and 6. Because the axis of the second decay need not line up with that of the first decay (they are independent events), the spectrum of the three alpha particles' energies will not be a pure line spectrum even if only reaction (13) occurs, but it will include a line component if there is any reaction (13).
The experimental evidence favors the mechanism of reaction (13), introduced by Salpeter and Hoyle. The equilibrium reached for reaction (13a) depends as usual on the environmental conditions; at stellar interiors of 100,000,000 degrees and density 100,000 times that of water, the equilibrium concentrations obey the following relationship (where we use the chemist's notation of square brackets for the concentration of a component in a mixture):

Given the resulting [Be-8], the production of C-12 and all heavier elements will depend on the rates of the steps of reaction 13. Those rates will depend strongly on the relationship between the available "heat of reaction" of the Be-8 + He-4 combination and the "excitation energy" of the C-12* excited states that are available. The rate will be most strongly enhanced ("resonance") if the available energy slightly exceeds the energy required for a state C-12* that meets all of the necessary symmetry rules. The probability of an event is zero if it violates conservation of energy between initial and final states (intermediate states briefly occupied may violate conservation of energy according to the Heisenberg Uncertainty principle). According to quantum mechanical perturbation theory, the probability of an event for which there is enough energy will be inversely proportional to the square of the energy surplus. Thus the rate of the reaction depends strongly on the energy levels of excited states C-12*.
We can see again the great value of the nuclear physics measurements that were accumulated by the program of the Kellogg Lab. In this case, Ward Whaling measured the spectrum of alpha particle energies as well as the spectrum of the C-12* relaxation photons resulting from the reaction,

Since the intermediate nucleus must be O-16, the work also gave nuclear energy levels for that nucleus. The results, of course, did show an excited state of C-12 at a useful energy near 7 MeV.
The [He-4] does reach very large values in the later stages of the life of a star, since the core will be nearly pure He-4 following the burning of the hydrogen. Hence it is reasonable to expect a small but significant concentration of Be-8 to result, with a continuing siphoning-off of a fraction of those nuclei to C-12 by reaction 13.
- Fowler's Teaching
A brief reminiscence may be in order. In the Fall of 1969 and Winter of 1970, as a senior, I took Fowler's Lectures in Nuclear Astrophysics. Fowler would routinely arrive early (the class was from 8 to 9 on Monday, Wednesday, and Friday) to begin filling the boards. It was not so much to get a head start as it was to be able to talk while observing the class for any evidence of understanding or, perhaps more importantly, confusion. My notes for 12/2/69 start with the following:
Extra !!! Reines (UC Irvine) claims that the cross section for anti-neutrino scattering on electrons is 1000 times the Feynman Gell-Mann value via Universality.
These neutrino scattering cross-sections are of the order of 10-48 m2 Our galaxy has an area on the order of 10+42 m2. Willie Fowler is a scientist whose interests span a range of ninety orders of magnitude!
Radioactive decay provided one of the earlier glimpses of the role of randomness in quantum mechanics. The key idea is that all atoms of any chemical species are identical, except for the number of neutrons in the nucleus. Thus any sample consisting of a specific isotope of an element will consist of a number of atoms with identical nuclei. The decay of each nucleus depends on the internal state of that nucleus only, occurring randomly at some time in the future. The probability that the decay of a specific nucleus will occur during some interval of time is determined by the internal state of the nucleus, not by the duration of time that the nucleus has already been in its present state.
We consider a radioactive sample that is of macroscopic size, perhaps a half a pound (a quarter of a kilogram). We will start by considering the simplest case, a radioactive nuclide that decays directly into a stable nuclide. We can measure the quantity of the sample remaining undecayed at any given time by the mass of the sample or by the number of nuclei present in the sample. We will call the quantity of remaining radioactive material X(t), where X may be measured in kg, in moles, or in nuclei. We can reasonably pretend that X(t), is a smooth, continuous function.
We know that the number of atoms remaining in the sample at time t, N(t), is really an integer, albeit a quite large integer, requiring perhaps 23 digits to write, and that it does not decrease smoothly, but rather in sudden jumps, dropping from N to N-1 at the instant of the decay of a particular nucleus. However, considering that the very best mass measurements have far fewer than 23 digits of accuracy, the cumulative effect of the series of small changes in the 23rd digit is quite reasonably approximated by a smooth curve.
Qualitative Predictions
If we plot a graph of X(t) vs. t, what can we predict about the shape of the curve?
- The original radioactive material continually decays away, it does not spontaneously increase. The longer you wait, the less there is, so the graph is everywhere downward sloping.
- The bigger the sample, the more decays will occur in a given time period. For example, if you have twice as large a sample size, you would expect twice as many decays in any interval of time, and hence a graph that was falling twice as steeply. Therefore, as the sample decays, and the remaining number of the original nuclei decreases, the rate of decay, in decays per second, will also decrease, so the downward slope of the curve's tangent line (see Fig. 8) becomes steadily more gentle.
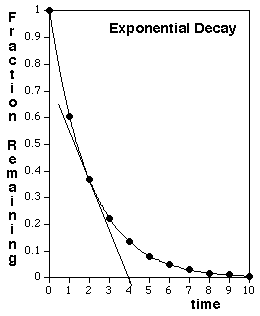
Figure 8: Exponential Decay of a radioactive sample.
The curve shown in Fig. 8 is calculated based on the analysis presented in the next section, for the ideal case of a single, pure radioactive isotope that decays directly into a stable isotope. A qualitatively similar shape would also be observed, although with a mathematically distinct curve, if the original sample contains a mixture of radioactive isotopes, or if a pure radioactive isotope is present that decays into another radioactive isotope.
Quantitative Predictions
How can we go beyond these two qualitative assertions about the shape of the curve of X(t) vs t? To derive the shape of the curve as a mathematical theorem requires the calculus, and is therefore beyond the scope of these notes. However, it is possible to see the outlines of the argument using only algebra, and it is instructive to do so because we will encounter very similar arguments in other contexts. The mathematics for the shape of the radioactive decay curve occurs in several situations in the physical and life sciences, including, for example,
- the filtering of photons out of a beam of X-rays (discussed in Chapter IV);
- the removal of toxic materials, such as acetominophen (Tylenol), from the blood by the liver;
- the collapse of a human population whose women, on average over a sustained period of time, each give birth to fewer than two children.
What happens to X(t) if we wait a short period of time, dt? Because some of the material will decay, we can write

where the quantity decaying, D(t,dt), will clearly depend on X(t) and the duration of the interval, dt. The more material present, the more will decay during any interval. The radioactive decay of each nucleus happens spontaneously, by random chance, without reference to external conditions or events. For each of the nuclei that are present at time t, there is some small probability, P << 1, that a decay will occur while you wait, during the short interval from t to t+dt. Since this probability is the same for each nucleus, the best prediction we can make for the number of decays during the interval dt is to multiply that probability times the number of nuclei. Therefore, we must have the following:

where the probability of decay, P(dt), depends on the duration, but not on the quantity present. What can we say about P? We have already observed that the decay is independent of previous history. For short intervals, where P << 1, the rate of decay will be essentially constant during the interval, because X won't have changed very much. That means that if we wait twice as long, we expect twice the probability of decay. Algebraically, then, Eq. 17 must take the following form in the limit of short dt:

where the probability of decay per unit time and per unit quantity,  , is a positive number. (The symbol "" is not used here to stand for a wavelength.)
What is the special character of Eq. 18? It says that the change in a quantity during an interval of time is the product of a physical constant, the duration of the interval, and the initial value of that quantity. All equations meeting that description have the same kind of solution: exponential decay if there is a negative sign, as here, or exponential growth, if there is no negative.
- In the case of exponential growth, there is a characteristic "doubling time," T, such that
N(t+T) = 2N(t) .
For example, the doubling time of a population of well-fed fruit flies is about 50 hours.
- In the case of exponential decay, there is a characteristic "half-life," T, such that
N(t+T) = N(t)/2 .
For example, in a healthy adult person, at normal dosage levels, the liver will remove acetomiophen from the blood with a half-life of about four hours.
How do we prove these two claims? Using the calculus, Eq. 18 leads directly to a simple differential equation for X(t):
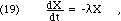
whose solution is a negative exponential time dependence:

Since the units of are inverse time, Eq. 20 will often be re-written using  = 1/, which will have units of time:

where is the mean lifetime of the decay. See the discussion in Chapter II, section G, for further details, particularly on the distinction between mean lifetime () and the half-life (T).
The first five problems are designed to provide background for the Franck-Hertz experiment, which you may do at some point this term. Some useful information is presented here first. Recall that 1 Volt = 1 Joule/Coulomb, and that the magnitude of the charge on an electron is e. Thus the product, eV, is a unit of energy (called an "electron-Volt").
c = 2.9979 * 108 m/s
h = 6.6262 * 10-34 J/Hz
e = 1.6022 * 10-19 Coulomb
1 eV = 1.6022 * 10-19 Joules
An electron's mass = 9.11 * 10-31 kg.
The mass of an atom of mercury = 3.331 * 10-25 kg.
- What is the speed, in m/s, of an electron with a kinetic energy of 5.0 eV? What fraction is this of the speed of light? Are relativistic effects likely to be significant?
- Such an electron strikes a stationary mercury atom head on and "sticks" (a "perfectly inelastic" collsion), so that their velocities are the same. (This can only happen if the atom is capable of absorbing the change in total kinetic energy internally, or if a more complicated process such as photon emission occurs; at these energies such three-body interactions are very unlikely.) Use conservation of momentum to predict the speed of the combination (in m/s) and the kinetic energy of each, in eV. How much energy must the mercury atom's electron structure have absorbed?
- If the electron bounces straight back with it's original speed (it would of course be slightly slower in a perfectly elastic collision), use conservation of momentum to predict the speed of the recoiling mercury atom in m/s. What kinetic energy would the mercury atom then have, in eV?
- The Handbook of Chemistry and Physics, 54th Edition, page E-212, in the table titled "Persistent Lines of the Elements," claims that the spectrum of mercury includes a line of wavelength = 2536.519 Ångstroms. What is the energy in eV of a photon of this light?
- Estimate the cathode's temperature based on its "glowing red hot" appearance and from that calculate the expected magnitude of the variations in the electrons' kinetic energy.
- The picoammeter used to measure the plate current of the Franck-Hertz tube takes about two seconds to fully respond to a changed current. Why is it designed that way?
- Describe an experiment (the physical situation, the measurements performed, the results obtained, and the analysis of the data) that provides evidence for the quantization of atomic electron energy.
- Sketch graphs of the spectrum (relative intensity as a function of energy) of radioactive decay particles typical of a pure alpha emitter and of a pure beta emitter. Explain the differences and relate appropriate features to the ground state energies of the mother and daughter nuclei.
Previous Next
Return to Radiation Notes Home Page
Dick Piccard revised this file (https://people.ohio.edu/piccard/radnotes/stellar.html) on December 29, 2004.
Please E-mail comments or suggestions to piccard@ohio.edu.
Copyright © 2004 Richard Dickson Piccard. All rights reserved.