What is ionizing radiation? It is radiation that can eject one or more electrons from a neutral atom, thereby creating two charged particles ("ions"), spoken of together as "an ion-pair," the negatively charged electron and the positively charged atomic core that is left behind. In order to be ionizing, the radiation must be able to deliver enough energy to a single atom to remove an electron. The minimum required amount of energy depends on the target material, typically between a half-dozen and a dozen electron-volts (eV) for elements and many compounds. What is an electron-volt? The following facts provide an intuitive feel for the nature of this unit of energy:
Chemical reactions involve re-arrangements in the atomic orbital electrons, forming and breaking chemical bonds between atoms. Radioactive decay involves re-arrangements of the protons and neutrons within the atomic nucleus, usually transforming one element into another.
The sources of ionizing radiation include the decay of naturally occurring radioactive materials, cosmic rays, the ultraviolet portion of sunlight, artificially created radioactive materials, and a variety of machines (either by design or by accident). Ionizing radiations themselves are of three types:
All three types are emitted in one radioactive decay process or another.
The various types of ionizing radiation interact with matter in a variety of ways, sometimes transferring only a small portion of their energy to the target, sometimes all of it at once. In this chapter we will examine natural sources of ionizing radiation. In Chapter II we discuss the analysis of experimental data, in Chapter III artificial radiation sources, in Chapter IV the interactions of radiation with matter, in Chapter V detectors of ionizing radiation, in Chapter VI radiation damage and dose measurement, in Chapter VII diagnostic and therapeutic uses of radiation, and in Chapter VIII diffraction and microscopy.
The structure of an atomic nucleus depends on the number of neutrons (N) and the number of protons (Z) within it. N and Z determine the balance of the repulsive electrostatic forces among the positively charged protons against the attractive strong nuclear forces among the nucleons (a generic word for protons and neutrons). Any nucleus can be fully described by the two numbers, N and Z, but the conventional method is to specify the nucleus with a more redundant notation, for example:
The central letter is the standard chemical symbol for the element whose nucleus we are discussing, in this case uranium. The 92 is the number of protons, Z, in the nucleus, which is, of course, also the number of orbital electrons in the neutral atom. The 146 is the number of neutrons, N. The 238 is the total number of nucleons, N + Z, usually symbolized as A, for "atomic mass number." Clearly, the chemical properties depend on the number of electrons surrounding the nucleus, and that must equal Z to give an electrically neutral atom, so the central letter uniquely determines Z. Since A = Z + N, and Z is known from the element, a common shorthand notation is to specify only the chemical identity and A. In our example, we might speak of U-238. Many elements exist with more than one value of A; the nuclei with the differing values of A and N, but the same Z, are known as isotopes of that element: because they have the same chemical properties, they belong on the same place in the periodic table.
The strong nuclear attraction exists between any two nucleons: two protons, two neutrons, or a neutron-proton pair. It depends on separation roughly as the product of a decreasing exponential factor and an inverse square factor. Although it is comparable in strength to the electrostatic repulsion of two protons at nuclear separations (1 femtometer, usually called a "Fermi" and abbreviated fm), it is negligibly small at separations of even a few nuclear diameters. This is generally spoken of by saying that "the nuclear force has a finite range," in contrast, for example, to gravity and electrostatic forces, which weaken comparatively slowly with increased distance.
In nuclear physics, it usually turns out to be more productive to speak of energy relationships than of force relationships. Because the forces are "conservative," it is a straightforward exercise using calculus to translate between energy and force descriptions. The interesting quantities are the binding energies ![]() of the nuclei: the difference between the total energy of the assembled nucleus and the total energy of N isolated neutrons and Z isolated protons. By measuring atomic masses with great precision and using Einstein's famous relationship that
of the nuclei: the difference between the total energy of the assembled nucleus and the total energy of N isolated neutrons and Z isolated protons. By measuring atomic masses with great precision and using Einstein's famous relationship that
![]()
one can establish the binding energy of each known nucleus. To see the patterns more clearly, the usual presentation is in terms of the binding energy per nucleon, ![]() /A, as a function of nuclear mass number, A, for the most stable nucleus with that nuclear mass number. This "curve of binding energy" is shown in Fig. 1 (after Marmier and Sheldon, 1969, Fig. 2-3; see also Halliday and Resnick, 1981, Fig. 47-6). The graph was prepared by using Excel to plot data calculated from the atomic masses listed in the CRC Handbook of Chemistry and Physics, 66th Edition.
/A, as a function of nuclear mass number, A, for the most stable nucleus with that nuclear mass number. This "curve of binding energy" is shown in Fig. 1 (after Marmier and Sheldon, 1969, Fig. 2-3; see also Halliday and Resnick, 1981, Fig. 47-6). The graph was prepared by using Excel to plot data calculated from the atomic masses listed in the CRC Handbook of Chemistry and Physics, 66th Edition.
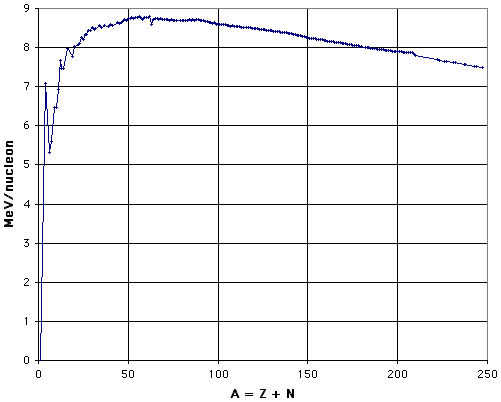
Figure 1: Binding Energy per Nucleon.
In Fig. 1, data points are plotted for the most tightly-bound nucleus of each nuclear mass number for which there is a naturally occurring stable isotope of greater than 1% natural abundance of that element, or for the longest half-life isotope of those elements that have no stable isotopes. The sparseness of the data points beyond A = 210 arises from the fact that there are no stable isotopes of any element beyond bismuth in the periodic table. See also the discussion in section C, "Charting the Nuclides."
The general pattern is of lower values at the light and heavy extremes, with a broad maximum from A = 52 to A = 62. The top ten nuclei have binding energies per nucleon that differ by only 0.4%, and include three isotopes of chromium, three of nickel, two of iron, and one each of cobalt and manganese. The fact that the ends are lower than the middle provides the energy that is released by fission of heavy nuclei or fusion of light nuclei, whether in reactors or weapons. As can be seen by inspection of Fig. 1, fission of the heaviest nuclei into two roughly equal fragments can be expected to yield about 1 Mev per nucleon, and fusion of hydrogen to helium can be expected to yield about 7 MeV per nucleon. This is one of the reasons why "hydrogen" (fusion) bombs are more powerful than "atomic" (fission) bombs.
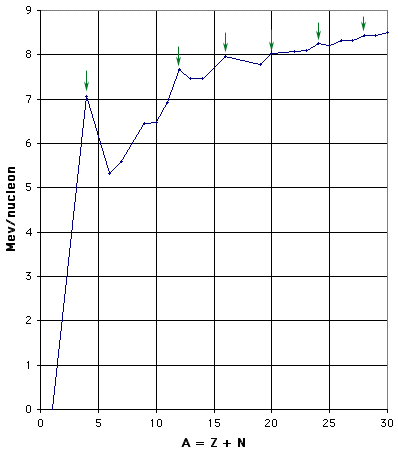
Figure 1(b): Binding Energy per Nucleon - expanded scale for low mass nuclei. The green arrows indicate the nuclei of mass 4n for n = 1, 3, 4, 5, 6, and 7.
As shown in Fig. 1(b), there are peaks and dips for small A, repeating every fourth nucleon. This periodicity is one clear indication of structure within the nucleus. In particular, those nuclei that can be thought of as containing an exact number of alpha particles (two neutrons and two protons) are more tightly bound than their neighbors. This effect is more pronounced for the lightest nuclei, but is still perceptible up to A = 28. For those nuclei with A > 20, the number of neutrons exceeds the number of protons, so that they clearly are not just conglomerations of alpha particles.
As you can see from the graph, there are no natural isotopes with A = 5 or with A = 8. This fact complicates the issue of stellar nucleosynthesis, as discussed later in this chapter.
The Coulomb electrostatic forces weaken with increased separation in accordance with the familiar inverse-square law, while the strong nuclear forces weaken in proportion to the product of the inverse-square of the separation times a negative exponential of the separation. Therefore, at larger separations the repulsive Coulomb forces between protons dominate the attractive strong nuclear forces between protons and between neutrons and protons, but a small separations, the strong nuclear attraction dominates the Coulomb repulsion. The overall effect is that two protons do not quite bind, but neutrons and protons together do bind to form nuclei. This leads to several interesting consequences:
Another way to examine the information that has been accumulated about nuclei is to construct a graph with axes showing N vs. Z, and plot points for each isotope in defined classes (see Walker, et. al., 1977). The graph in Fig. 2 displays one point for each isotope in the following three classes:
The plotted points represent all of those isotopes that are included in the curve of binding energy in Fig. 1-1, and also, for most values of Z, one or more slightly less strongly bound isotopes of greater or lesser nuclear mass.
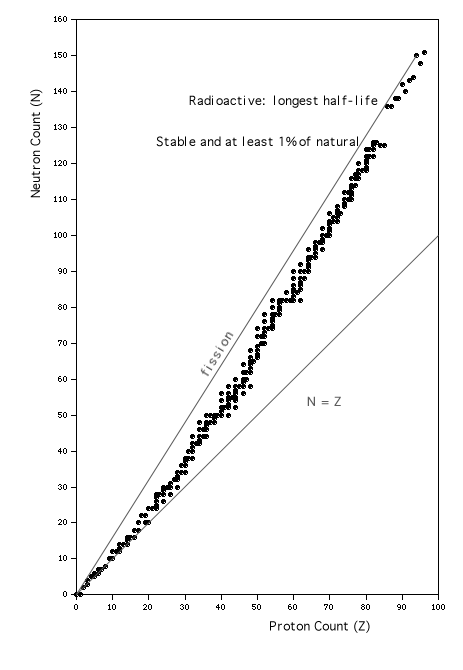
Figure 2: Chart of the Nuclides; based on information included in the "Table of the Isotopes" in section B of the CRC "Handbook of Chemistry and Physics," as transcribed by the students of the1989 Medical Physics course at Kalamazoo College.
A close inspection of the figure reveals several interesting features.
Delayed neutron emission would suffice to sustain the chain reaction of a power reactor. Prompt neutron emission (within perhaps a microsecond after the fission) is required to sustain the chain reaction of a bomb. Neutrons emitted with a low velocity, or which have been slowed down by collisions with other nuclei (so-called "thermal" or "moderated" neutrons), can contribute to sustaining a power reactor's chain reaction, but are not likely to reach another intact nucleus, to cause a fission, in time to contribute to an explosive chain reaction. The probability of a neutron to cause a fission does depend on the neutron's kinetic energy.
An alternate view of the chart of the nuclides is to consider the ground state energy per nucleon as a function of N and Z. For stable nuclei, this energy is just the negative of the binding energy per nucleon. For the unstable nuclei, the "ground state" energy is positive, so that one thinks in terms of a surface that displays a groove known as the "valley of stability." The farther away from the central trend of that valley a particular nucleus lies, the less likely it is to be stable. Spontaneous nuclear transformations, radioactive decay, always take nuclei to states of lower energy, hence "down into the valley of stability."
Radioactive decay is a nuclear transformation, a sudden shift from an original state (the mother nucleus) to a final state (the daughter nucleus). One of the major advances of understanding encompassed within quantum mechanics is this concept of states of a system, and the "quantum jump" transistion from one to another. If the initial and final states of the system being studied have different energies, as is typical for spontaneous changes, conservation of energy requires that other forms of energy be absorbed or emitted as part of the state change (for example, one or more photons). The understanding of quantum mechanical state transitions began with the study of atomic (electron) behavior and then later included the nuclear (neutron and proton) behavior. There are two types of evidence for quantum mechanical states that we will discuss: spectroscopy and the Franck-Hertz experiment.
As mentioned above, conservation of energy is often achieved by the emission or absorption of photons of electromagnetic radiation. This radiation was in fact quite well studied even before the invention of quantum mechanics. When atoms are heated to high temperatures (for example, in a flame) their electrons are often in states of high energy. More or less promptly they will spontaneously "decay" or "relax" to a state of lower energy, emitting a photon that carries away the difference in energy between the initial and final states.
The experiment consists of measuring the intensity of the radiation as a function of frequency, the "spectrum." The results follow one of four basic patterns, or a mixture of them: first, some samples display a smooth variation of intensity with wavelength, a "continuous spectrum." Second, some samples show zero intensity except at specific wavelengths where the intensity can be very high, a "line spectrum." The third and fourth patterns are the results of absorption instead of emission with continuous or line character. These last two cases involve experiments that place the sample between the light source and the observer, while in the first two cases the sample is the light source.
The existence of line spectra, whether of absorption or emission, is taken as evidence for quantum mechanical state changes, reasoning as follows. The wavelength and frequency of any electromagnetic radiation have product equal to the speed of light, so if one is known the other can be calculated. The photoelectric effect experiment, as discussed in chapter IV, indicates that the energy of a photon is proportional to its frequency, so the existence of line spectra indicates that specific energies of photons are much more likely to be absorbed or emitted than other energies. By the conservation of energy, then, we can conclude that certain specific values are much more often seen for the difference between initial and final energies of the system, in this case an atom. Finally, consideration of the whole set of photon energies for any given atomic system reveals a clear pattern: the many observed lines of the spectrum can be explained by supposing that the atomic system can exist only in states of specific energies, fewer in number than the photon energies to be explained, with the photon energies equal to the differences between the state energies. The ability to explain many observed photon energies with only a few atomic energy levels is particularly convincing.
The quantization of atomic energy revealed by spectroscopy is confirmed by experiments involving the collision of atoms and electrons. When a moving electron collides with an atom two things may happen: each may behave as a point particle, the sort of collision studied in introductory physics in which momentum, kinetic energy, and total energy are all conserved (an "elastic collision"), or the internal structure of the atom (electrons surrounding a nucleus) may come into play, with the kinetic energy of the incident electron being partly transformed into internal energy of the atom (momentum and total energy are still conserved, but the total kinetic energy of the electron and atom changes).
In the case of an elastic collision, the electron transfers some of its kinetic energy to the atom, but not much because the electron is so much lighter than the atom. In the case of an inelastic collision, the kinetic energy of the electron is reduced by the amount transferred to the atomic structure, which can be very nearly 100% of the electron's initial kinetic energy. If the atom and electron nearly "stick together," a so-called "perfectly inelastic" collision, conservation of momentum ensures that they will move very slowly afterward, compared to the initial speed of the electron. Hence, they will carry away only a small fraction of the electron's initial kinetic energy. Therefore, such "sticky" collisions can happen if, and only if, the atom in question can absorb nearly all of the initial kinetic energy of the incident electron into its internal structure.
The results of such electron-bombardment experiments (as well as other types of experiments) are that an atom's internal energy can be changed by certain specific amounts only; that is, the change in total kinetic energy (which is equal to minus the change in the atom's internal energy) is observed to have only certain values, never any other values, provided the atom is left intact and not ionized. An atom of any element must therefore have a characteristic smallest amount of energy that can be transferred to its internal (atomic electron) structure. Since the final kinetic energy is always a positive value, or zero, a bombarding electron with less than the smallest excitation energy cannot excite the atom, and so must interact with it elastically, if at all.
In the Franck-Hertz experiment, whose circuit arrangements are shown in Fig. 3(a), below, a "vacuum tube" containing mercury (Hg) is heated in an oven (not shown in the figure) so that a modest number of Hg atoms will be vaporized. The vapor pressure of Hg depends strongly on temperature; in order to have an appropriate density of Hg vapor, the tube must be operated at about 170 oC (= 338 oF!). Electrons are boiled off of a negatively charged cathode and accelerated from it toward a positively charged grid, moving through a region containing only a low-density Hg vapor. After they reach the grid, those electrons that pass through the holes in it coast toward an anode (or "plate") whose potential is maintained at zero, a less positive value than the grid. Thus the electrons steadily slow down as they move from the grid toward the anode, and only those going fast enough at the grid will make it all the way to the anode. The picoammeter serves not only to keep the anode at ground potential, but also to measure the current flowing through the wire, required in order to neutralize (i.e., to carry away) the arriving electrons, so as to hold the anode at a fixed (ground) potential. Thus the current measured by the picoammeter serves to show the rate of arrival at the grid of electrons with so much kinetic energy that they can make it through the retarding electric field to reach the anode. In practice, the retarding potential difference between grid and anode is on the close order of one Volt, and the accelerating potential difference between cathode and grid is varied from zero Volts up to about 50 V.
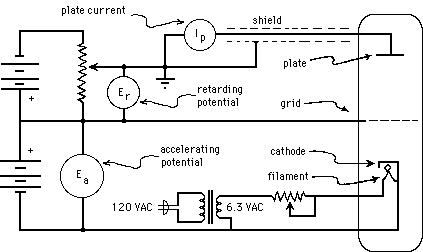
Figure 3a: Simplified Franck-Hertz Circuit.
As can be seen from the circuit diagram, the cathode is indirectly heated (by infrared radiation from a filament). This is done so that the electrons will all have the same initial potential energy, regardless of when or where they boil off from the cathode. (A directly heated cathode, which serves as its own filament, will have varying potentials at varying places, even if it is DC heated. If it is AC heated, then it will also have varying potentials at varying times.) As the kinetic energy of the electrons increases along their path, they eventually attain sufficient kinetic energy to excite an Hg atom (provided the accelerating potential is great enough). If they do excite a mercury atom, they will be left with nearly zero kinetic energy, but are then accelerated again towards the grid. This situation is illustrated by Fig. 3(b), below. In the first case, segments (a) and (b), the accelerating potential, ![]() , is adjusted to a value nearly adequate to bring each electron's kinetic energy above the minimum excitation energy of the Hg atom,
, is adjusted to a value nearly adequate to bring each electron's kinetic energy above the minimum excitation energy of the Hg atom, ![]() . (
. (![]() is in fact slightly less than 5 eV.) Because it never exceeds that minimum energy, however, only elastic collisions occur, and no significant energy loss is observed. Once the electrons pass the grid, they are slowed down, but not stopped before reaching the anode. Because this accelerating potential is inadequate to bring any of the electrons to a kinetic energy exceeding
is in fact slightly less than 5 eV.) Because it never exceeds that minimum energy, however, only elastic collisions occur, and no significant energy loss is observed. Once the electrons pass the grid, they are slowed down, but not stopped before reaching the anode. Because this accelerating potential is inadequate to bring any of the electrons to a kinetic energy exceeding ![]() , all the electrons that pass through the grid can be expected to reach the anode, and a large current will be observed. The sloped segments would actually be linear only if the cathode, grid, and anode were all parallel planar surfaces, which is not typically the case. Using that simplification here, however, does not alter our conclusions.
, all the electrons that pass through the grid can be expected to reach the anode, and a large current will be observed. The sloped segments would actually be linear only if the cathode, grid, and anode were all parallel planar surfaces, which is not typically the case. Using that simplification here, however, does not alter our conclusions.
In the second case, segments (c) through (f), each electron reaches a kinetic energy exceeding ![]() before reaching the grid. While continuing to accelerate through the Hg vapor (at the top of segment (c)), each electron has some non-zero probability of experiencing an inelastic collision with each Hg atom it passes. If the Hg vapor is sufficiently dense, only a short distance will be traversed before such a collision occurs, removing virtually all of the electron's kinetic energy (going to the bottom of segment (d)). Since the electrons will not all have their collisions at the same point, we see that collectively segment (d) is really many different segments in parallel, but with the same vertical extent, since the same amount of energy is being absorbed by each of the Hg atoms. The slopes of segments (c) and (e) are identical, being determined by the charge on the electron and the electric field strength. Thus, geometrically, all of the various segments (d) lead to the same segment (e). In the illustrated case, the electrons have not reaccelerated sufficiently by the time they reach the grid to be able to coast all the way to the anode against the retarding electric field. Instead, they stop in mid-space part way across the gap, and then return to the grid, which they eventually strike and are absorbed by. This situation, then, is characterized by a truly tiny current observed in the anode wire, since few electrons are reaching the anode.
before reaching the grid. While continuing to accelerate through the Hg vapor (at the top of segment (c)), each electron has some non-zero probability of experiencing an inelastic collision with each Hg atom it passes. If the Hg vapor is sufficiently dense, only a short distance will be traversed before such a collision occurs, removing virtually all of the electron's kinetic energy (going to the bottom of segment (d)). Since the electrons will not all have their collisions at the same point, we see that collectively segment (d) is really many different segments in parallel, but with the same vertical extent, since the same amount of energy is being absorbed by each of the Hg atoms. The slopes of segments (c) and (e) are identical, being determined by the charge on the electron and the electric field strength. Thus, geometrically, all of the various segments (d) lead to the same segment (e). In the illustrated case, the electrons have not reaccelerated sufficiently by the time they reach the grid to be able to coast all the way to the anode against the retarding electric field. Instead, they stop in mid-space part way across the gap, and then return to the grid, which they eventually strike and are absorbed by. This situation, then, is characterized by a truly tiny current observed in the anode wire, since few electrons are reaching the anode.
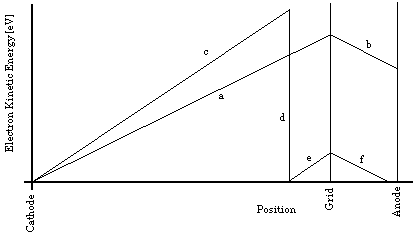
Figure 3b: Simplified plot of electron kinetic energy as a function of position along the trajectory, for two different accelerating potentials. Segments (a) and (b) are shown with
0.9
and segments (c) through (f) are shown with

1.1
.
For larger accelerating potentials, the sloped segments between the cathode and grid become progressively steeper. Each time along its path that an electron's kinetic energy exceeds the atomic excitation energy, inelastic collisions become possible, and if the Hg vapor is dense enough, likely. Thus, as the accelerating potential difference, between the cathode and the grid, is increased, the kinetic energy of the electrons reaching the grid increases until it is slightly more than the first excitation energy of the Hg atoms; then more and more of the electrons reach the grid after having transferred their energy to an atom, arriving at the grid with nearly zero kinetic energy. The number of electrons reaching the grid with kinetic energy above any specific intermediate value will therefore fluctuate as the grid potential increases. Such electrons are "counted" by applying the steady retarding potential between the grid and the anode and then determining the electron current reaching the anode by measuring the current flowing to the anode from the power supply that maintains it at a constant potential. Typical results are shown in Fig. 3c.
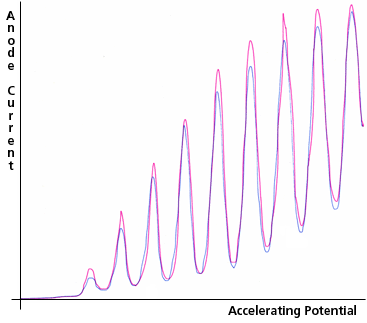
Figure 3c: Anode Current as a function of Accelerating Potential in the Franck-Hertz Experiment. Two replications are shown. The peak anode current is about 1 nA and the peak accelerating potential is about 50 V.
In order to reduce the impact of amplifier noise in the picoammeter, it is designed to have a gradual response. The combination of that picoammeter characteristic with less than ideally smooth adjustment of the accelerating potential created several artifacts in the curves of Fig. 3c (e.g., the second, third, and seventh peaks of the red curve).
During operation a faint blue-violet glow comes from the space between the cathode and the grid. The light emitted by mercury atoms as they return to their ground state (after excitation by the electrons) is ultra-violet, and therefore is not the light you can see. The likely cause of the glow that you can see is bremsstrahlung from scattered electrons (see Ch. IV, section C). In their Nobel Prize winning work, Franck and Hertz performed a more complex version of the experiment, in which they simultaneously measured the anode current and the intensity of the ultra-violet light as they increased the accelerating potential. This light was observed to increase in intensity as a uniform step function, with jumps that coincided with each dip of the anode current, as each electron in its trajectory became able to excite one more Hg atom (which at some prompt later time returned to its ground state by emitting an ultra-violet photon).
As discussed above, using an indirectly heated cathode guarantees that the surface from which the electrons are boiled off has a well-known potential. However, the initial kinetic energy of the electrons and of the mercury atoms will exhibit random variations on the order of kT, where T for the electrons will be the Cathode's absolute temperature (red hot, ![]() 900 oK), and T for the atoms will be the oven's absolute temperature (
900 oK), and T for the atoms will be the oven's absolute temperature (![]() 440 oK). The uncertainty in the initial kinetic energy of the collision is therefore going to be about 0.1 eV, dominated by the cathode's temperature. This will limit the quality of the individual data points and therefore also of the averaged results. The series resistor in the filament circuit, as shown in Fig. 3(a), reduces the heating of the cathode to a temperature just adequate to boil off enough electrons. By keeping the cathode cooler, the intrinsic experimental uncertainty is reduced. The ratio of the maximum accelerating potential to the thermal fluctuations in the intial kinetic energy clearly indicates that the 50 Volt range of accelerating potentials over which useful data can be taken need only be divided into 500 intervals. This justifies the use of 9- or 10-bit numbers (512 or 1024 distinct levels) for an automated version of the experiment.
440 oK). The uncertainty in the initial kinetic energy of the collision is therefore going to be about 0.1 eV, dominated by the cathode's temperature. This will limit the quality of the individual data points and therefore also of the averaged results. The series resistor in the filament circuit, as shown in Fig. 3(a), reduces the heating of the cathode to a temperature just adequate to boil off enough electrons. By keeping the cathode cooler, the intrinsic experimental uncertainty is reduced. The ratio of the maximum accelerating potential to the thermal fluctuations in the intial kinetic energy clearly indicates that the 50 Volt range of accelerating potentials over which useful data can be taken need only be divided into 500 intervals. This justifies the use of 9- or 10-bit numbers (512 or 1024 distinct levels) for an automated version of the experiment.
Dick Piccard revised this file (https://people.ohio.edu/piccard/radnotes/radioactive.html) on December 29, 2004.
Please E-mail comments or suggestions to piccard@ohio.edu.